To run the code, download the zip file: flowmap.0.1.alpha.zip. You should also download and install Java 5 or higher, either the JDK or the JRE. Unzip all the files into a directory. All the files should reside in the same directory. There should be several files: epsgraphics.jar, j3dcore.jar, prefuse.jar, prefusex.jar, and vecmath.jar
From the command line, type: java -jar flowmap.0.1.alpha.jar.
There is also a .bat file for those of you on windows. You can click this, and assuming Sun's Java is installed, it should work.
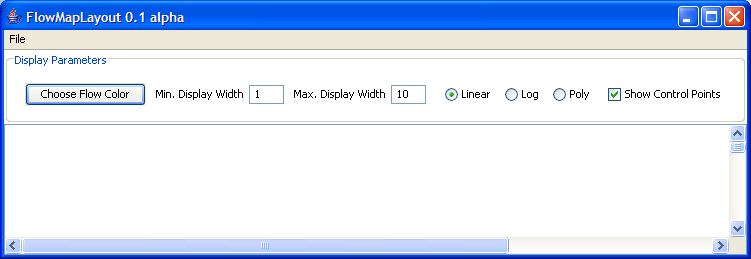
You should get a screen that looks like this:
The File menu allows you to open a .csv file (two of which are provided in the .zip), which opens a .csv file and renders the map. You also can save the current visible image of the flow map to .jpg or .eps.
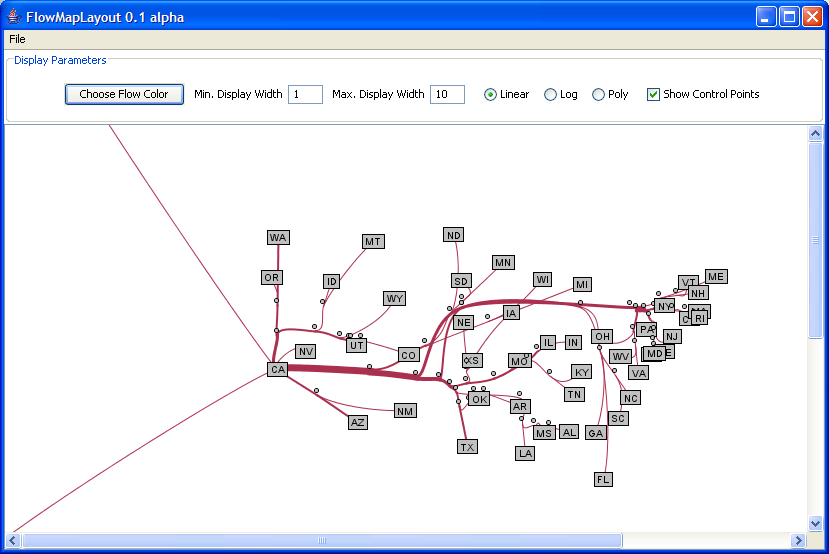
Try loading ca.census.inflow.2000.routing.noadjust.csv to see migration to California with edge routing and no layout adjustment.
The control panel allows you to choose the foreground color of the map, change the display widths of the map (hit enter after updating the number), choose if the scaling is linear, log, or polynomial. You can also choose if the control points are visible.
You can drag the control points of the map around. Right click and drag will change the zoom level. Left click and drag will move the map.
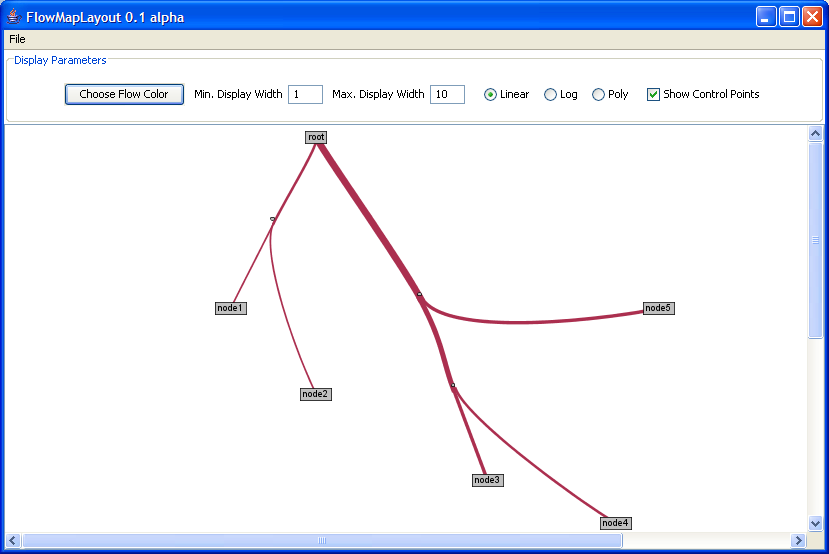
The provided data files should look like this: direct.csv is on the left and ca.census.inflow.2000.routing.noadjust.csv is on the right.
To generate different maps, provide different CSV files to the application. A CSV file consists of some configuration options, the data for the source node, and the data for the destination nodes. We provide some commentary for part of a .csv file to explain the format.
#ca.census.inflow.2000.routing.noadjust.csv
Any line preceeded with a # is a comment, which means the program ignores it.
layout: mercator or direct. Mercator means the x, y, data for the rows will be projected to latitude and longitude. Direct means the program will treat the x, y, data as screen positions. Keep in mind that the java coordinate space means X increases to the right and Y increases towards the bottom.
#First line must be layout information
layout: mercator
#layout: direct
edgeRouting: true or false. This tells the program to attempt to route edges around obstacles.
#Next line must be whether to use edge routing or not
edgeRouting: true
#edgeRouting: false
adjustNodes: true or false. This tells the program to shift the position of nodes so that there is more space between them, but they maintain their relative position to one another.
#Next line must be whether to use layout adjustment or not
adjustNodes: true
#adjustNodes: false
We then must specify a name for the root node, an x, and a y. Here we are giving the latitude and longitude for California.
#next is source info
#source name, x, y
CA, 37.824644286057, -120.823074866985,
Finally, we specify destinations. Destinations have a name, an x (latitude), a y (longitude), and a value. This might be reversed from how you think of it, so be careful! Also, values must not have commas in them.
#destinations go on next lines
#name, x, y, value
AK, 60.3501992402253, -149.230191831236, 9914
AL, 32.880450063677, -86.702509865832, 10007
If you are getting errors when you run the code, you can try disabling the edge routing by setting it to false to see if the program still manages to draw something.
Best of luck!
last modified February 24, 2007