CS 248 - Introduction to Computer Graphics
Autumn Quarter, 2008
Marc Levoy
Lecture notes for Tuesday, September 30
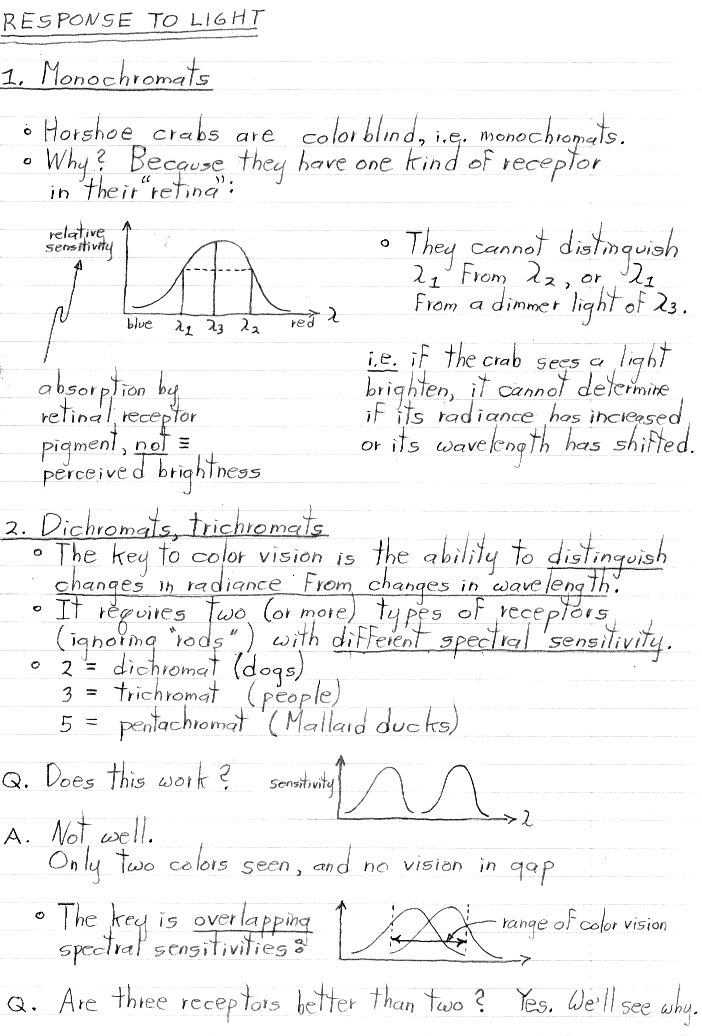
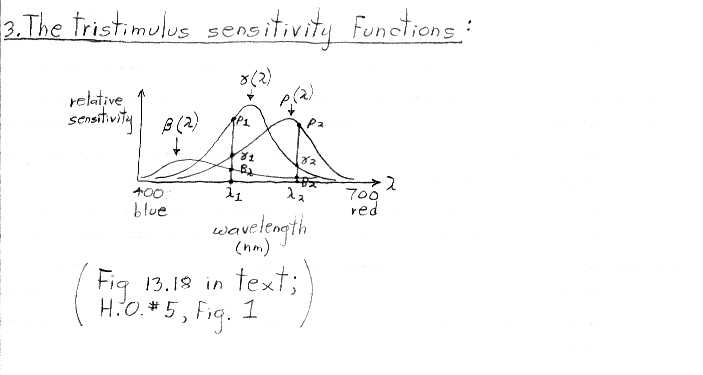


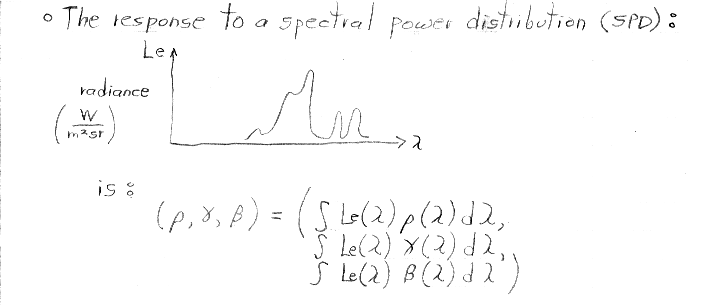
In my notes above, "n lambda sub 1" means "n units (possibly fractional) of radiance of a stimulus having wavelength lambda sub 1. It doesn't mean a unit stimulus of wavelength n x lambda sub 1.
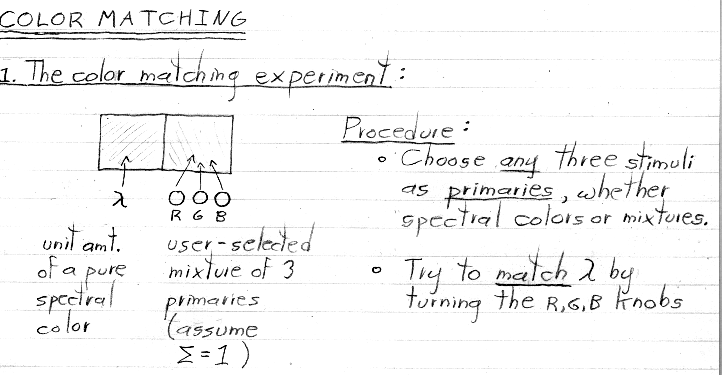
As explained in class, if the human subject in Young's experiment was allowed to manipulate only the three knobs shown above, he or she would have failed to match the pure spectral color stimulus on the left side most of the time. More specifically, if the primaries (on the right) were pure spectral colors, matching of the stimulus (on the left) would be successful only at three wavelengths, corresponding to the wavelength of each of the three primaries. If the primaries were not spectral colors, matching would never be successful.
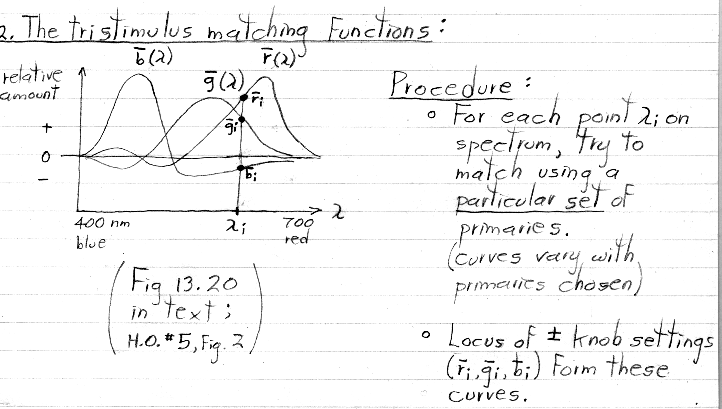
Young further showed that the subject could indeed achieve a match in these cases, but only by desaturating the stimulus. This was done by allowing the subject to add a bit of one or more of the three primaries to the stimulus (on the left), instead of to the matching color (on the right). In this case, the amount they added would be recorded in the corresponding matching function as a negative value. This explains the negative-going portions of these curves. For the case of primaries that are pure spectral colors, only one knob on the left side would need to be tweaked at a time, in order to achieve a match. This explains why only one curve is negative-going at each point along the spectrum.
Note: The place in this figure where the red and blue curves cross, and the leftmost crossing of the red and green curves, should lie exactly on the zero line. Figure 2 in handout #5 is more accurately drawn and places these crossings correctly. These crossings are at the three wavelengths just mentioned, where the wavelength of the stimulus matches the wavelength of a primary, and thus the stimulus could be matched using a single knob on the right side.
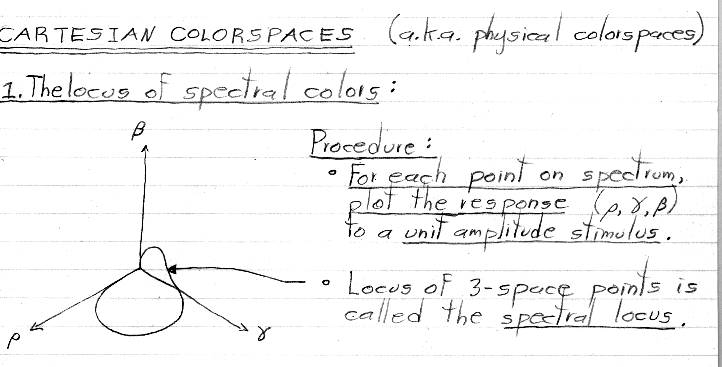
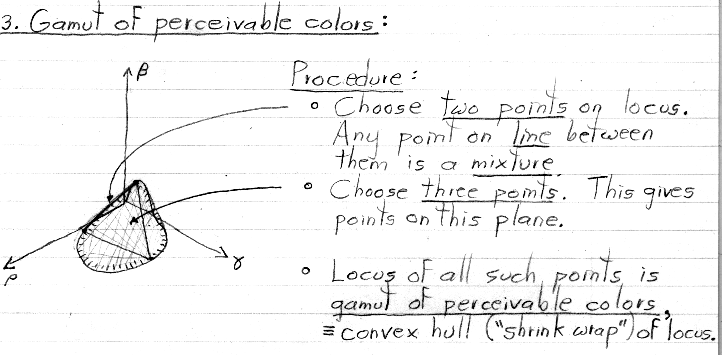
Initially, this is the same situation as depicted in the previous section (#3), except that we make it a point to choose pure spectral colors whose amplitude=1 points lie roughly on the red, green, and blue parts of the spectral locus. We are also allowing mixtures of these R,G,B primaries whose sum lies between zero and one, rather than being normalized to one. This leads to colors that occupy the volume between the shaded plane and the origin. This volume is called the gamut of reproducible colors for these particular primaries.
Note that this gamut touches the locus of spectral colors at only three points (other than the origin), These points correspond to the three primaries. In terms of Young's matching experiment, the knob for one primary is set to its maximum at each of these points, and the other two knobs are set to zero. Looking at figure 2 of handout #5, these points correspond to the three places on the lambda axis where one plot is high and the other two are at zero. As explained previously, these places correspond to the wavelengths of the (pure spectral) primaries, which are listed beside the figure.
If the R,G,B primaries are not pure spectral colors (i.e. single wavelengths), then they can be represented as mixtures of pure spectral colors. In this case, their amplitude=1 points will fall somewhere strictly inside the volume shaded above, rather than falling on the spectral locus. The gamut of colors reproducible using these non-pure primaries will shrink accordingly, to span these new points.
Remember also that the primaries don't need to be in the red, green, and blue parts of the spectral locus. Choosing different wavelengths (or mixtures of wavelengths) as primaries will move the amplitude=1 points (and the corresponding gamut) around. However, the gamut will always fall within the convex hull ("shrink-wrap") of the spectral locus, because that represents all the (normalized) responses possible in our visual system, and therefore the full range of colors we humans can see.
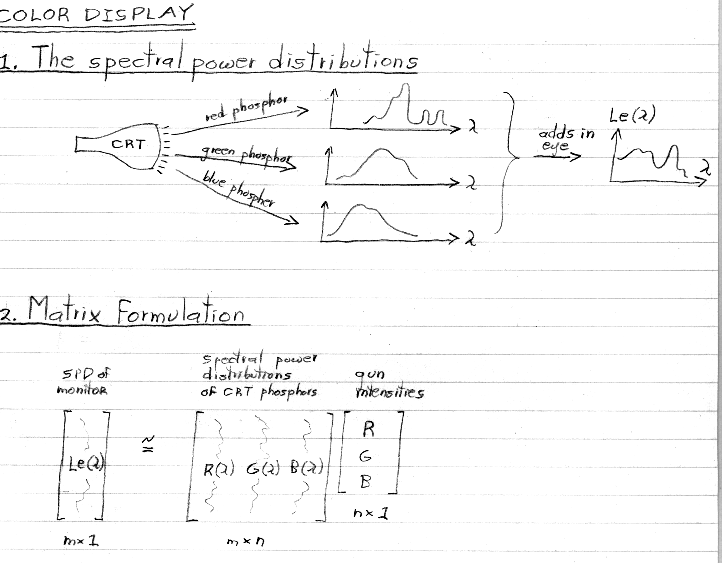
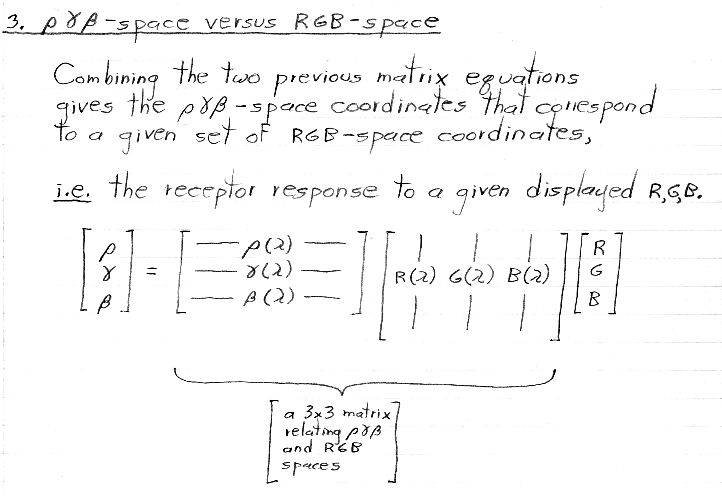
A good example of a system that employs non-spectral R,G,B primaries is a color raster display...
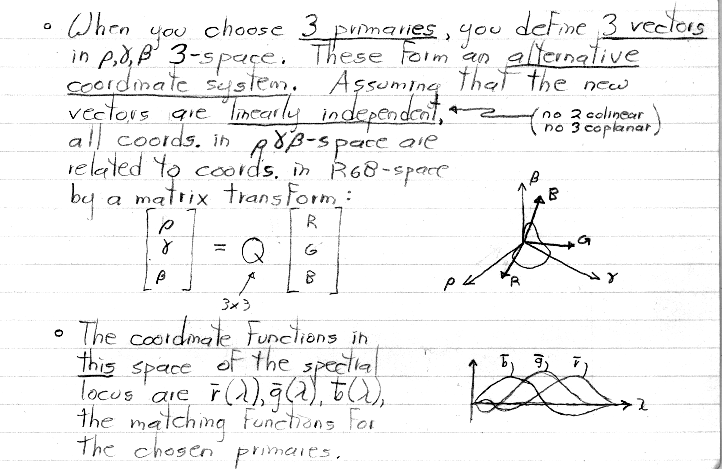
Note: As in the earlier figure, in the plot above, the red and blue matching functions should cross exactly on the zero line.
