Many real-world domains can be represented as large node-link graphs: backbone Internet routers connect with 70,000 other hosts, mid-sized Web servers handle between 20,000 and 200,000 hyperlinked documents, and dictionaries contain millions of words defined in terms of each other. Computational manipulation of such large graphs is common, but previous tools for graph visualization have been limited to datasets of a few thousand nodes.
Visual depictions of graphs and networks are external representations that exploit human visual processing to reduce the cognitive load of many tasks that require understanding of global or local structure. We assert that the two key advantages of computer-based systems for information visualization over traditional paper-based visual exposition are interactivity and scalability. We also argue that designing visualization software by taking the characteristics of a target user's task domain into account leads to systems that are more effective and scale to larger datasets than previous work.
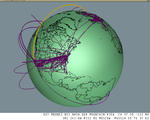
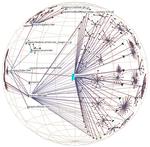
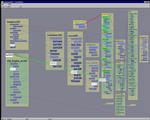
This thesis contains a detailed analysis of three specialized systems for the interactive exploration of large graphs, relating the intended tasks to the spatial layout and visual encoding choices. We present two novel algorithms for specialized layout and drawing that use quite different visual metaphors. The H3 system for visualizing the hyperlink structures of web sites scales to datasets of over 100,000 nodes by using a carefully chosen spanning tree as the layout backbone, 3D hyperbolic geometry for a Focus+Context view, and provides a fluid interactive experience through guaranteed frame rate drawing. The Constellation system features a highly specialized 2D layout intended to spatially encode domain-specific information for computational linguists checking the plausibility of a large semantic network created from dictionaries. The Planet Multicast system for displaying the tunnel topology of the Internet's multicast backbone provides a literal 3D geographic layout of arcs on a globe to help MBone maintainers find misconfigured long-distance tunnels.
Each of these three systems provides a very different view of the graph structure, and we evaluate their efficacy for the intended task. We generalize these findings in our analysis of the importance of interactivity and specialization for graph visualization systems that are effective and scalable.