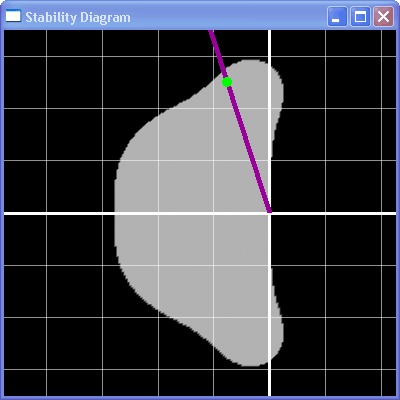
| Stability Analysis of a system of two linear ODEs. The green line is the known analytical solution to the system. The white is the numerical solution computed using the 4th order Runge-Kutta method. The stability diagram shows the stability region for this method plotted in the imaginary plane. The purple line corresponds to the primary eigenvector (lambda) of the linear system, and the green spot shows the location in the plane of timestep * lambda. The bigger the timestep, the farther out that spot moves. When it leaves the stability region, the method is no longer convergent. You can click and drag on either the spot in the stability diagram or the logarithmic slider in the main window to adjust the timestep and see how the numerical solver's behaviour changes. |
 |
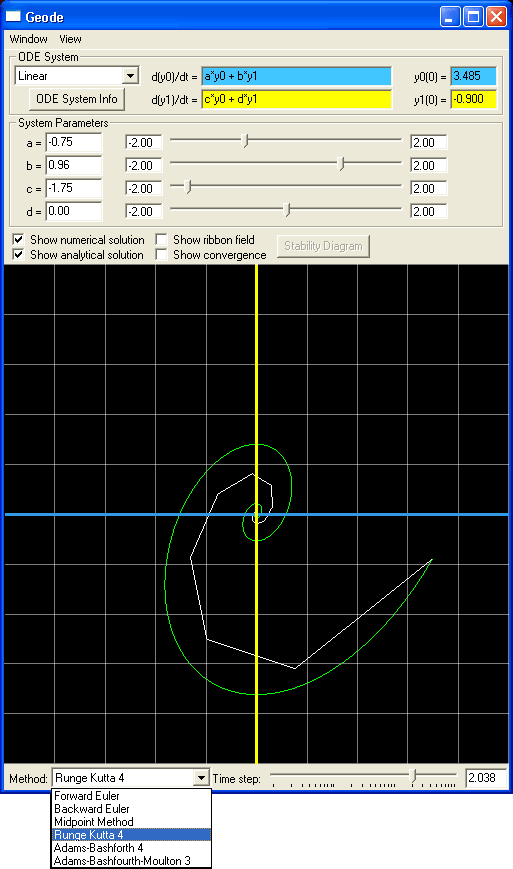
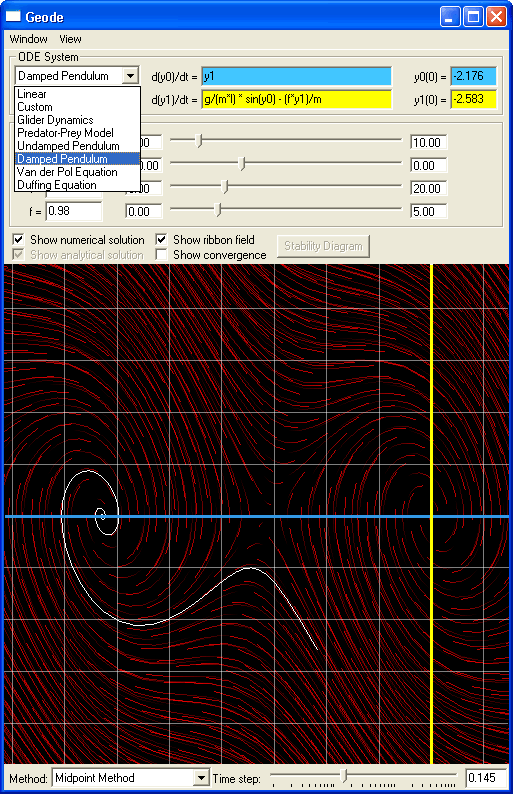
The list of Preset ODE systems is expanded so you can see all of the systems that are built into Geode.
