For my dissertation project, I developed new ways of measuring small changes in how hard people are thinking or how loaded their short-term memory is while they use a computer by recording very small variations in their pupil diameter with an eye tracker. My contributions are mostly methodological: I established the feasibility of measuring cognitive load without head-mounted equipment, quantified the precision of such measurements, and extended the scope of cognitive pupillometry to more complicated, visual tasks, by combining pupil measurements with eye tracking data. I used these methods to measure the dynamics of cognitive load during mental arithmetic, simple vigilance tasks, visual search, mental rotation, map reading, and interactive exploration of a complex data visualization. I discovered new evidence that for simple numerical tasks, the advantage of visually presented material over auditory material is due to dual coding (internal representation in both the visual and verbal working memory).
At the beginning of 2007, I joined Mike Cammarano and Bryan Chan on
this project to automatically generate visualizations of semi-structured data, based
on a flexible schema matching between RDF data types and visualization display types. A
cost-sensitive graph search of the RDF graph based on types and names of data items is used
to assign data attributes to visualization attributes. We applied it to automatically visualize
semi-structure data from Wikipedia in maps, timelines, scatterplots, and network diagrams.
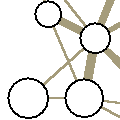
Ranking for Graph Drawing
How can ranking algorithms help in
the clean layout of graphs? When a graph is so dense you can only
draw a small piece of it, which subgraph should you draw? In Fall 2006,
I developed
a flow-based algorithm similar to PageRank to select a relevant subgraph
based on a focal node and user-supplied hints about which types of
nodes and relationships are important.
Graph Tables
I spent the 2005-2006 academic year working on
a formal algebra of graphs implemented on top of relational algebra.
This algebra is aimed at making it very easy to extract and flexibly visualize
the various graphs present in a relational database. The best way to see
what this is about is to watch the video demo.
Congressional
VoteViewer
The US House of
Representatives Clerk's
office publishes the records
of all roll call votes taken in Congress since 1990. This data
tells
you how
every congressperson voted on every bill and procedural issue. It's
great data, but it
doesn't come in a very usable form. In the spring of 2005, Mike Green and I made a web-based
visualization tool to make
this data more accessible. It's based on matrix permutations and is
focused on revealing
large-scale voting patterns in congress. When I get some free time, I'll
post the web app here. Stay tuned.
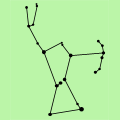
Visual Exploration
of Citation Networks
In early 2004, I crawled
the ACM digital library
and grabbed info and citation links for all SIGGRAPH papers from 1974-2003. I
made a graph-based
visual exploration tool for exploring the
collaboration and citation networks of SIGGRAPH papers and authors.
This project was
a preliminary exploration of some of the ideas I'm exploring in my
thesis research
on using graph drawing to explore general relational data.
Automatic View
Selection
Can a good viewing angle
for a 3D object be chosen automatically? What
makes a viewpoint good (or bad)? I spent some time during 2003 developing theoretic measures of the usefulness of a viewpoint based on sub-part visibility and silhouette edge detail.
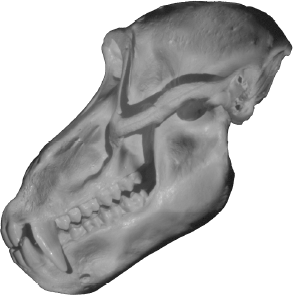
Image-Based
Relighting for Illustration
Photographs can be very
useful for documenting an object's appearance,
but the lighting control needed for a good photo can be difficult or
impossible to achieve. Dave Akers, Frank Losasso, and I made an
image-based relighting system that can be used to make photographic
composites that effectively convey an object's shape and features. It
was inspired by the techniques of lighting design and illustration.
Michael Cohen and some other folks at MSR and UW have done
some cool related work that goes farther than we did.
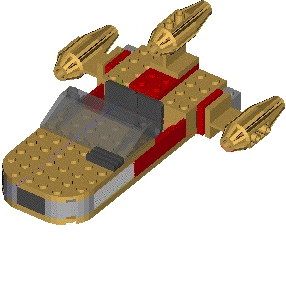
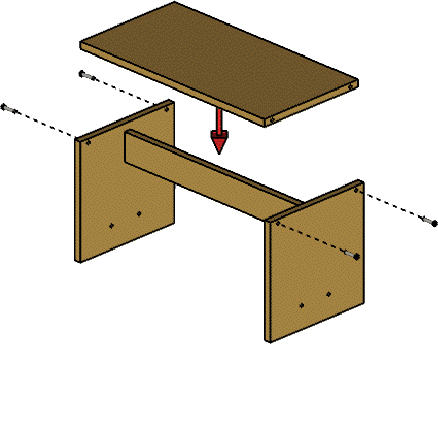
Generating
Step-by-Step Assembly Instructions
Everybody knows how
frustrating most assembly instructions can be.
During the fall of 2002, I worked with Maneesh Agrawala, Doantam Phan,
and Pat Hanrahan in C.S and Julie Tversky from the psych department on
a software system that generates effective assembly instructions
automatically, based on a combination
of cognitive models of assembly and geometric blocking analysis of parts to be
assembled. We presented this work at siggraph in 2003.
Phylogenetic Tree
Set Visualization
I worked with some great
folks at the University of Texas and the City University of New York on
the problem of visualizing
lots and lots of evolutionary trees. We came up with some neat
software that the biologists there liked. A write-up of this work constituted my
senior thesis at UT Austin. You can
read about recent developments in the project at its new website.