EE362 Project Report
Color Balancing For Digital Cameras
Measurements: Macbeth Color Checkers under Different Illuminations
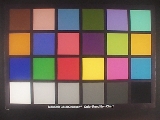
In this part of the measurement, we take photographs of Macbeth color checker under different illuminations. We would like to see how the digital cameras handle the color correction under those illuminations.
To create different illuminations, we purchased 17 different filters, including 5 blue filters, 5 amber filters, 4 green filters, and 3 magenta filters. We use those filters to cover the light source while taking photographs. (The light source is very hot, and we have to be careful not to get the filters melt.)
The images taken by Sony and Olympus cameras could be found here. I convert them to 100% quality jpeg files to be able to display on the web, the original .bmp files is also there.
After we got those images, we also measure the SPD of the light reflected from the white patch. The reason is that since we know the SPD of the reflectivity of the Macbeth color checker patches( from macbethChart in matlab ), we can calculate the SPD of the light sources from the light reflected from the white patch( the white patch reflected most of the light uniformly, so we choose it instead of other patches ). After we got the SPD of the filtered light sources, we could calculate the SPD of the reflected light from other patches and in term calculate other quantities like their XYZ values. By doing this we only need to make 18 measurements. If we want to measure the SPD of all the patches for all illuminations, we have to make 24x18 measurements.
Overview of the analysis
After getting the Macbeth color checker images and the SPD of the white patches, I would like to conduct the following experiments:
- Inverse Gamma Correction:
- Usually the digital cameras will do gamma correction before dumping out the RGB values, to make the analysis correct we have to undo the gamma correction.
- Asymmetric Color Matching:
- In the asymmetric color matching experiment with human subject, we try to match colors under 2 different illuminations. The result is that the matched colors are related by a common linear transformation. For the Macbeth color checker images, we would like to see if the RGB values of color patches under different illuminations are also related by a common linear transformation(for every 2 pairs of illuminations ).
- Comparing Color Correction for Sony and Olympus Cameras:
- I will make some comparisons between the color corrections done by both cameras, using the unfiltered light source as reference(it look like some kind of tungsten light ).
- Spectral Power Distribution of the Filtered Light Sources:
- Given the surface reflectances of the color patches and the reflected light SPDs of the white patch, we could calculate the SPD of the different light sources. After that we could also compute the spectral transmitivity of the filters.
- Reflected Light Spectral Power Distribution of the surface patches:
- after getting the SPD of the filtered light sources, and given the spectral reflectivity of the color patches, we could calculate the reflected light spd from those patches, and also their XYZ or Lab values.
Inverse Gamma Correction
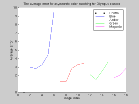
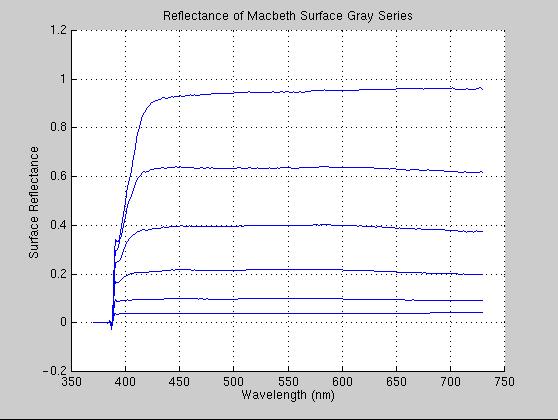
To do the inverse gamma correction, we could take advantage of the gray series of the Macbeth color checkers. Here is the plot of the SPD reflectance of the gray series using macbethGray.m :
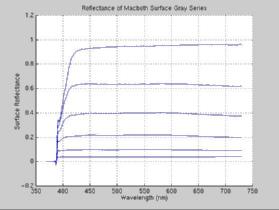
We can see that the reflectance of the gray series are pretty uniform between 450nm and 700nm. This is a big advantage for doing analysis, since for any light source SPD and linear sensors, the sensor responses to the gray series will be proportional to the surface reflectivity at any wavelength between 450nm and 700nm. So the raw RGB values of the gray series patches should be proportinal to their reflectivity. I measure the reflectivities at 600nm and get the following result:
| Patch | White | Neutral 8 | Neutral 6.5 | Neural 5 | Neural 3.5 | Black |
| Reflectance | 0.9531 | 0.6381 | 0.4002 | 0.2171 | 0.0979 | 0.0375 |
To get the RGB values of the color patches, we should do proper filtering since the imaging process is noisy. I use a small window(20x20) inside each color patch and calculate the average of the pixels to get the color using getMacbethColors.m and getColors.m as follows:
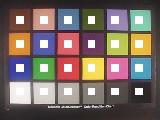 where the white windows is my sampling windows.
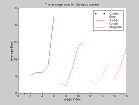
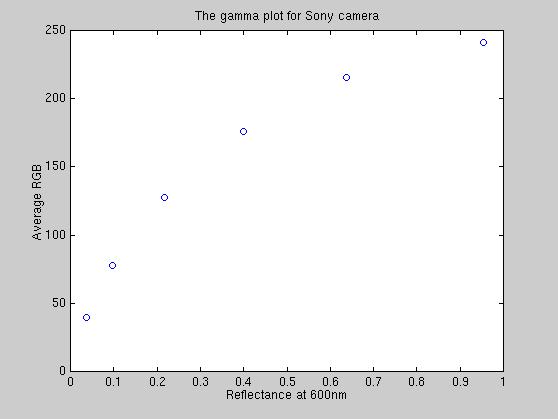
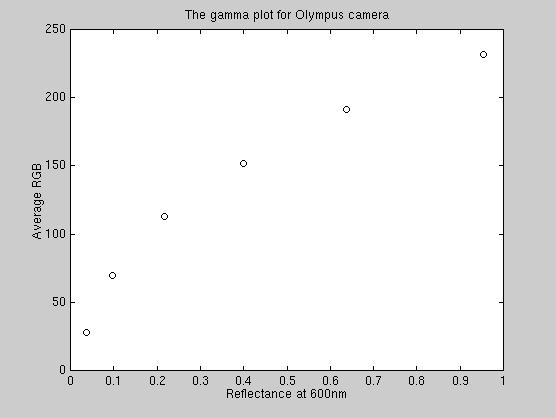
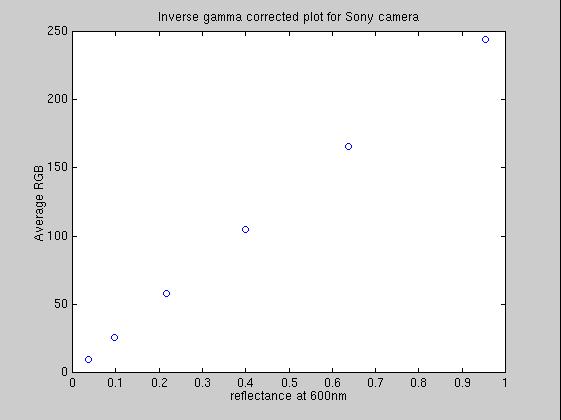
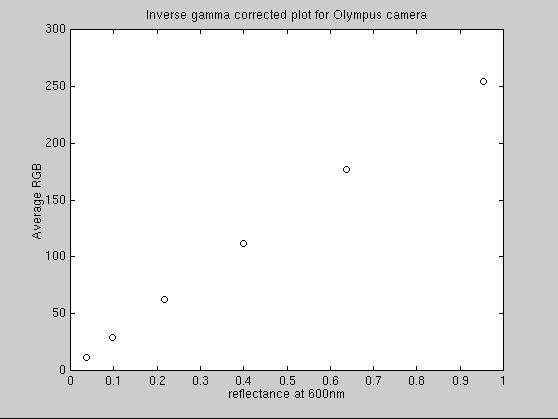
After we get the reflectance and RGB values of the gray series, we can plot them using gammaPlot.m:
Obviously, the RGB and surface reflectances are not linearly related, they display a very obvious gamma corrected curve. The inverse gamma correction could be done using the following:
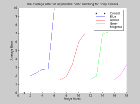
The inverse gamma corrected images has the linear plot as show below, they are generated by verifyInverseGamma.m.
Note the plots are linear.
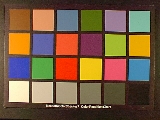
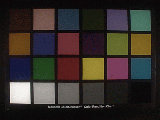
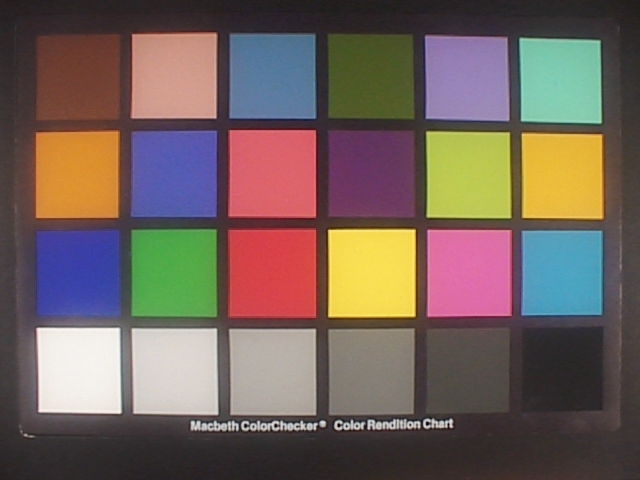
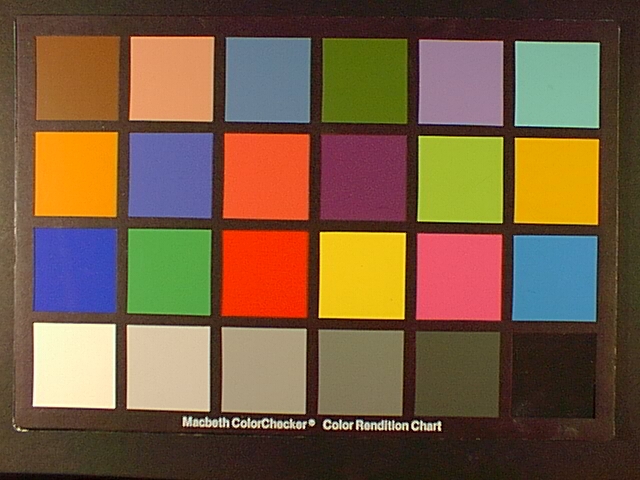
For comparision the images before and after gamma corrections are show below:
| Camera | Sony | Olympus |
| Before Inverse Gamma Correction
|
|
|
| After Inverse Gamma Correction
|
|

|
We can see that after inverse gamma correction the images look darker, as expected.
We can use the codes above to do the inverse gamma correction for all the Macbeth color checker images, and get the patch colors using inverseGammaColors.m, I store the inverse gamma corrected color values in the following files:
Asymmetric Color Matching
For each pair of images taken under different illuminations by the same camera, we are wondering if there could exist a linear transformation that maps the colors in the first image to the 2nd image, similar to the asymmetric color matching experiment. The following experiment is conducted using the inverse gamma corrected colors from the Macbeth color images, and I compare each image under different illumination with the control image( in which the light source is not filtered).
The experiment is coducted using asymmetricMatching.m and asymmetricMatchingPlot.m:
| Sony | Olympus |
| Before Matching
|

|
|
| After Matching
|
|
|
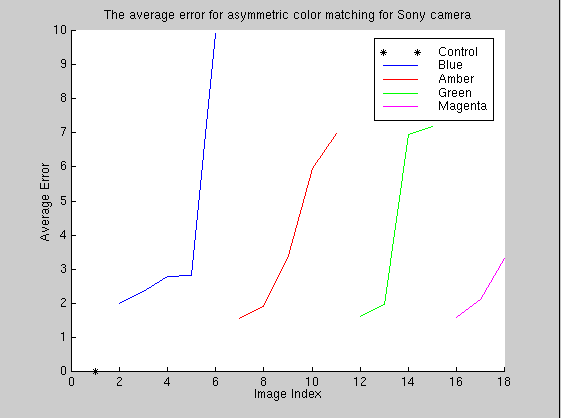
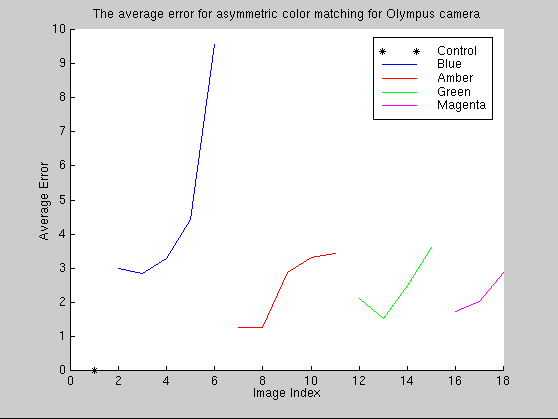
The average error is the RMS error for each color band.
We can make the following observations:
- The average errors after applying the linear transformation is much smaller than the original images. Under all lighting conditions the average error is less than 10. We could probably compare it with the asymmetric color matching experiment using human subject.
- The error increases as the illumination becomes more extremely filtered.
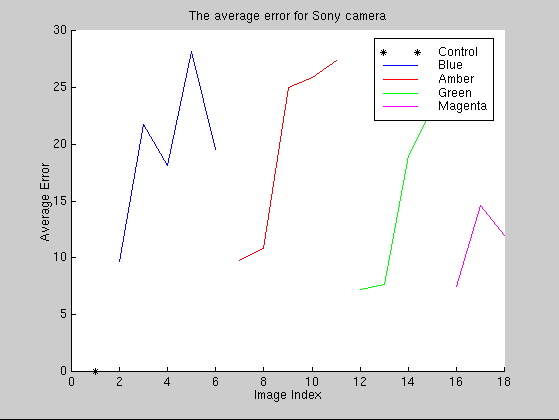
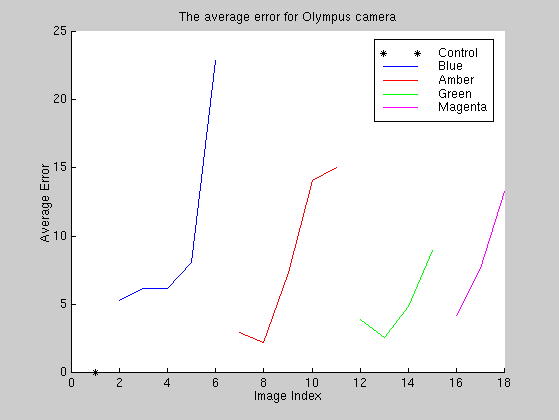
Color Correction Comparisons
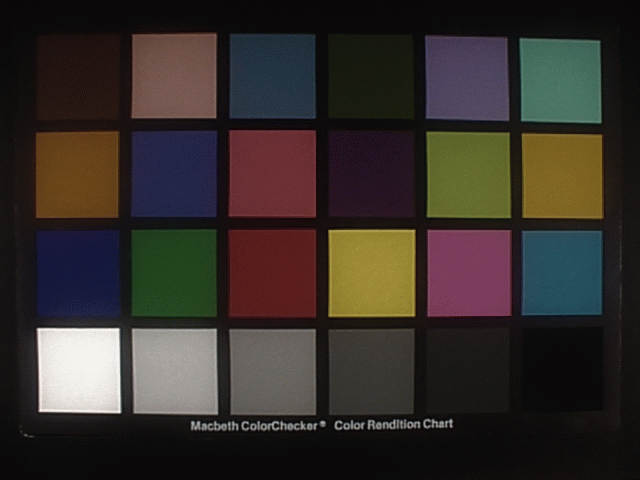
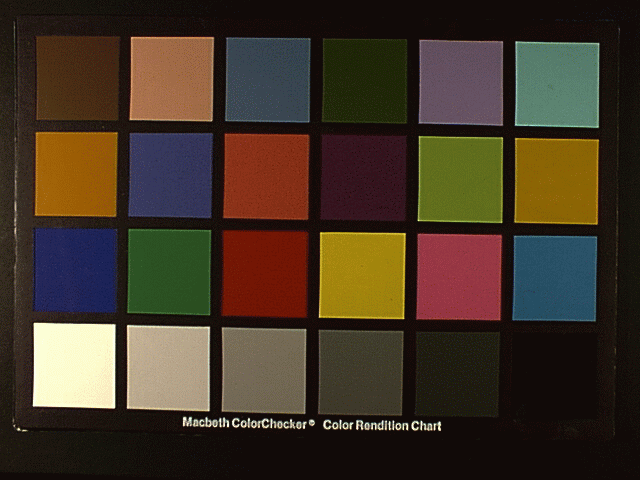
Use the unfiltered light source as the reference, we could compare the images taken by other filtered light sources with the reference image:
| Sony | Olympus |
|
|
|
- For Sony camera, the color correction is much worse than Olympus camera. The average errors for Sony are mostly beween 10-30, for Olympus cameras only the most extreme filters will cause the error to be over 10. We can also see this easily from the photographs, where obvious color shifting is visible.
- For Olympus Camera, the biggest error happened in the most extreme blue light. This is probably due to the reason that the cameras don't expect people to take photographs under very blue light source. Also the color correction is good even for the most extreme green light.
Spectral Power Distribution of the Filtered Light Sources
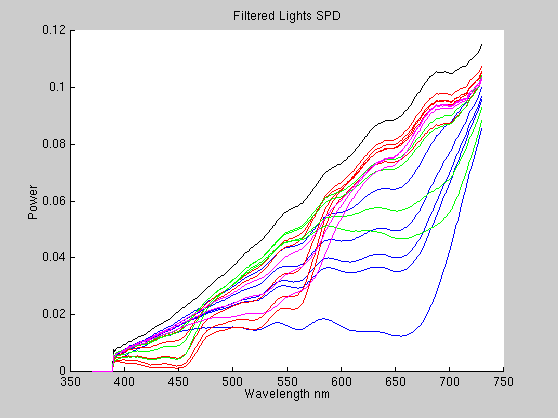
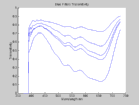
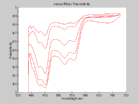
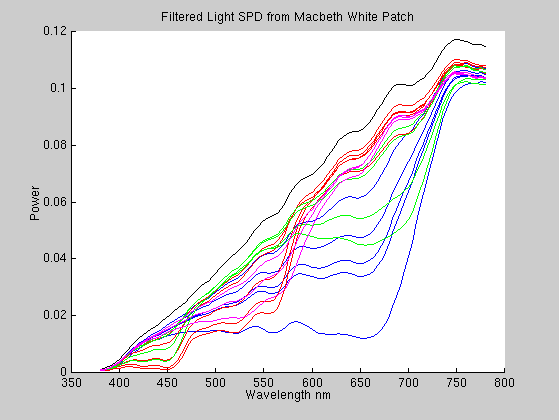
In order to know the SPD of the filtered light sources we used to get the images, we measure the SPD of the Macbeth white patch under different filtered light sources. The plot for the reflected filtered light sources is show here:
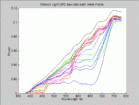 In the figures, I use blue lines to represent blue light sources, red lines to represent amber light sources, green lines to represent green light sources and magenta lines to represent magenta light sources.
Since I know the surface reflectance of the white patch( using the macbethChart in matlab) I could calculate the SPD of the filtered light sources, dividing the reflected SPD by the surface reflectance using spd/getFilteredLightsSPD.m. The SPD of the filtered light sources are stored in filtered_light_spd.mat:
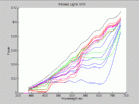
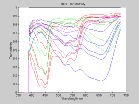
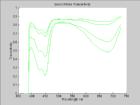
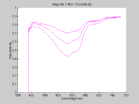
Spectral Transmitivity Distribution of the Filters
We can also calculate the filters transmitivity distribution from the filtered lights SPD and the unfiltered light SPD, dividing the filtered light sources by the unfiltered light source, using filtersSPD.m, the data is stored in here:
| All filters | Blue | Amber | Green | Magenta |
|
|
|
|
|
In above figures, I use blue lines to represent blue filters, red lines to represent amber filters, green lines to represent green filters and magenta lines to represent magenta filers. We can see that their spectral transmitivity matches to our intuition: the blue filters filter away low frequency band, amber filter filters away high frequency band, green filters preserve middle frequency band, and magenta preserve high and low frequency bands. Note that under all filters, they allow the really long wavelengthes to pass by, probably due to the reason that long wavelengh lights tend to penetrate materials more easily.
Reflected Light Spectral Power Distributions and XYZ values
We can them compute the XYZ for each patch under each illumination via computeXYZ.m, given that we know how to compute XYZ fro SPDs, the data is stored in macbethXYZ_filters.mat.
Conclusion
I have done the following analysis for images taken under different illuminations for both cameras:
- Inverse Gamma Correction:
- The gamma plots show that the cameras indeed perform inverse gamma correction before dumping out the RGB values. It's may be good for monitors that doesn't have their own gamma correction, but if the monitor has it's own gamma table then we have to undo the gamma correction to get the image right. So the right place to put the gamma correction should be the display devices, not the acquisition devices. But the problem may not go away for a while.
- Asymmetric Color Matching:
- There exist good linear transformations between the reference lighting and filtered lighting for different color patches, as long as the lighting condition is not too extreme. Under extremly lighting conditions the camera may perform some nonlinear color correction, which make the asymmetric color matching impossible.
- Comparing Color Correction for Sony and Olympus Cameras:
- Basically, Olympus camera outperforms Sony a lot in the color correction, as evident in the analysis above.
- Spectral Power Distribution of the Filtered Light Sources:
- We can estimate the SPD of the light sources, by just measure the SPD of the reflected light from the white patch under different illuminations. This could save us a lot of time in doing the measurements. I could calculate the SPD of the reflected lights from all color patches under different illuminations in this way.
- Reflected Light Spectral Power Distribution of the surface patches:
- The calculated SPD of the filters transmitivity corresponds nicely to our intuition about what the color of the filter should be. We also find out that it's hard to filter away really long wavelengths. Fortunately, they are not very visible anyway.
liyiwei@graphics.stanford.edu
The url of this page is at: http://graphics.stanford.edu/~liyiwei/project/ee362/report.html
 In the figures, I use blue lines to represent blue light sources, red lines to represent amber light sources, green lines to represent green light sources and magenta lines to represent magenta light sources.