Good:
A. W. Holleitner, R. H. Blick, A. K. Hüttel, K. Eberl, J. P. Kotthaus.
Science, Vol. 297 No. 5578. Page 70. 5 July 2002.
Story
The paper examines electron-sharing behavior at an electronic junction based on a pair of coupled semiconductor quantum dots.
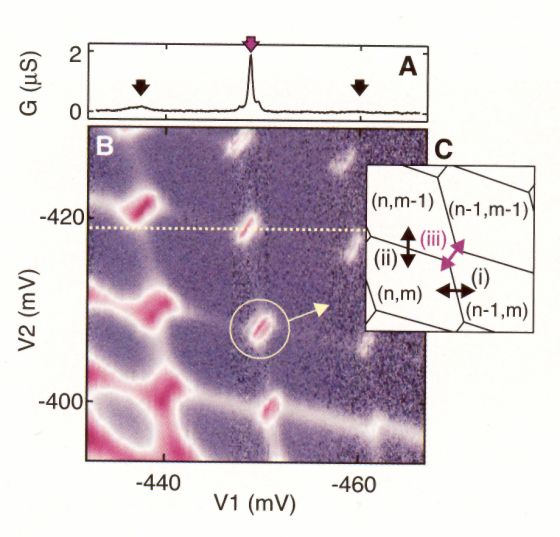
More Detail >>This diagram examines the differential conductance from source to drain as a function of the voltages at the two coupling electrodes. Each hexagonal cell represents a charge configuration with n electrons on dot 1 and m electrons on dot 2. A major effect the graph is intended to illustrate is the pronounced resonance produced by the exchange of two electrons in the coupling between configurations (n,m) and (n-1,m-1).
Critique
I found this diagram particularly elegant, as it presents a substantial body of raw, measured data in an accessible way while making the underlying structure readily apparent. Without having to look at the caption, I was able to correctly infer many of the facts it is intended to convey:- The main plot in part B shows a color-coded representation of a scalar function of two variables, with the parameters mapped to the axes.
- The plot in part A is a 1-D slice through the data corresponding to the dotted line in B. It gives a quantitative feel for the data and also elucidates the color-coding used in B.
- B makes the regularity and structure of the data trivially apparent, and directs the viewer's attention to the detail of this structure illustrated schematically in C.
In short, the diagram tells no lies and refrains from simplifying the data, but still illustrates its structure in a clear and appealing way.