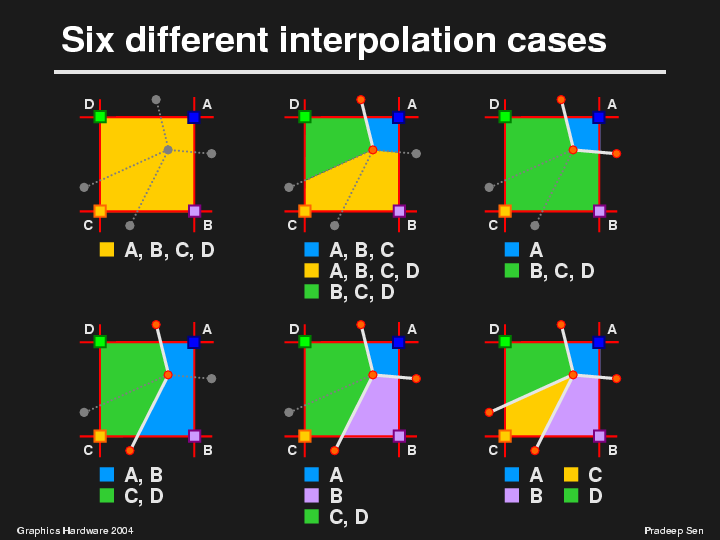
For example, in the top left corner we have the case where we have no edge at all in the cell. In this case, we shall use all four corner samples to determine the color of the new point, which is exactly the same as the standard bilinear interpolation.
In the second case, we have a situation with only one edge. There are many ways to interpret this, so we chose the algorithm that was easiest to implement. We decided that the one-edge case broke up the cell into three regions. The region shown in blue would consist of points points that would not have access to the D corner. This means that these points would only interpolate the values at A, B, and C to compute their color. Likewise, the points in the green region don't have access to the A corner because of the edge, and so would only use corner samples B, C, and D to compute their final value. Finally, the points in the orange region will have access to all four corners and thus perform full bilinear interpolation between the four corner color values.
There are a couple of different situations in which we can have two edges. In the first, the edges are at adjacent sides of the cell and in the second they are at opposite sides of the cell.
In the first case, shown in the top right corner, the blue region will only use corner A as its sample because all other corners have been blocked off by the edges. This means that the entire blue region will have a constant value, that of corner A. In the green region, which represents the rest of the cell, B, C, and D color samples are used.
In the second case, we have two regions which will use two corner samples each. Here the blue region will interpolate between samples A and B while the green region will use C and D.
We can continue like this for the remaining cases, but for the sake of time I shall move on. I show them here for completeness. Note that the "bullets" under each diagram indicate which corners are to be included in the interpolation for a point in that region.