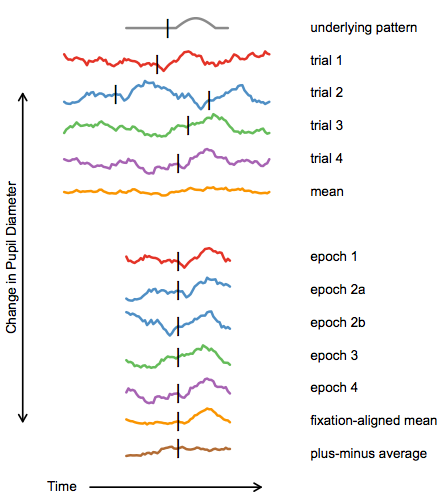
Figure 1: Illustration of epoch alignment via temporal translation followed by averaging. The top half of the figure shows four simulated trials with gaze events (fixations) occurring at various times. The simulated pupil diameter data for these trials is the sum of random walks (simulating typical background pupil motions) and a dilation response occurring at a fixed delay following the fixation (illustrated at the top of the figure in grey). Because the fixations in these four trials aren’t aligned, neither are the pupillary responses, and averaging without translation fails to recover the underlying pattern.
Epochs aligned by translation are shown in the bottom half of the figure. Because these epochs are aligned on their gaze events, the pupillary responses are aligned too, and averaging the five signals reveals the underlying pupillary response pattern. The final line in the figure is the ±-average of the four aligned signals (see Section 2.3.3), which shows the level of noise present in the mean above it.
In this example, the magnitude of the signal relative to the background pupil noise is exaggerated; in real pupil dilation data, many dozens (sometimes hundreds) of epochs must be averaged before the noise level in the average is low enough to distinguish the pupillary response.
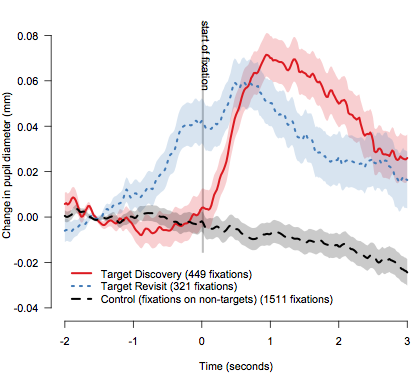
Figure 6: Average pupillary responses to first (discovery) fixations on targets vs. later (revisit) fixations on targets in a visual search task. The dilation response begins about one second before the fixation for revisits.
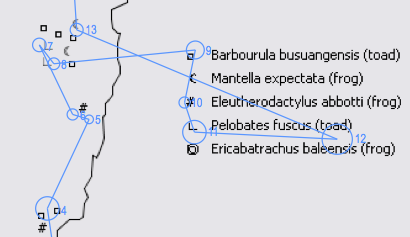
Figure 7: A fragment of a task map and corresponding legend. A sample scan path is shown in blue, with circle area proportional to fixation duration and numbers indicating the order of fixations. A legend reference epoch begins at the time of fixation 7 and ends at the time of fixation 13. The gaze events used for alignment of this epoch are the 8 → 9 and 12 → 13 saccades.