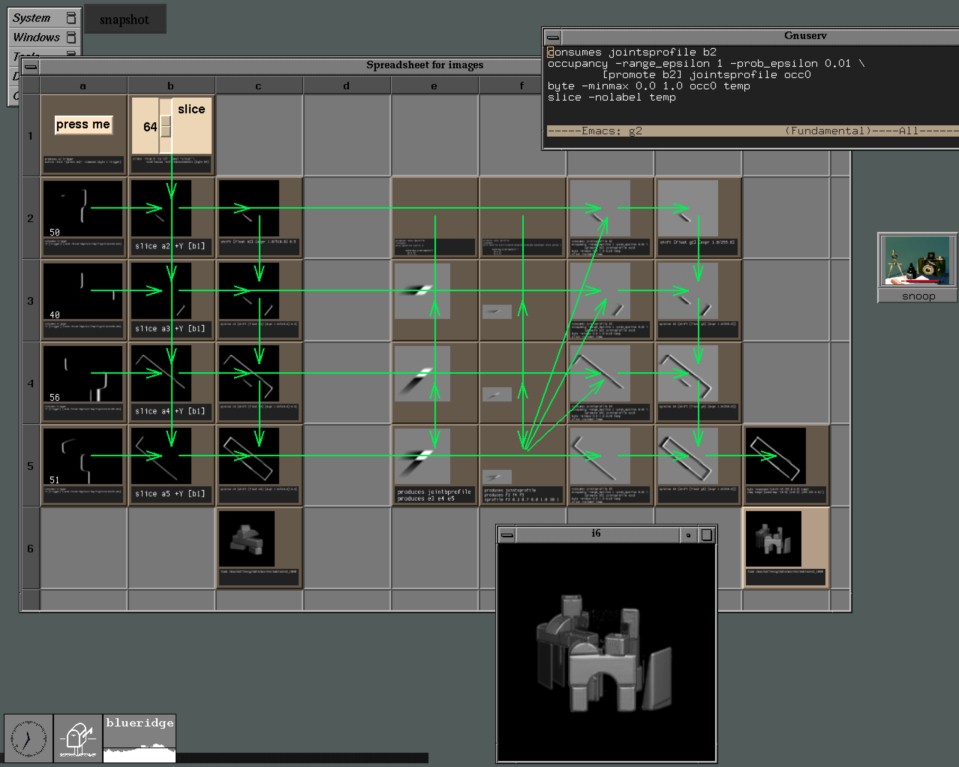
The majority of commercially available image processing and data visualization systems employ a dataflow paradigm. Users select modules from a menu and wire them together using an interactive flow chart editor. We are investigating an alternative paradigm based on spreadsheets. Cells in such a spreadsheet contain graphical objects such as images, volumes, movies. Cells may also contain graphical widgets such as buttons, sliders, or movie viewers. Objects are displayed in miniature inside each cell. Formulas for cells are written in a programming language that includes operators for array manipulation, image processing, and rendering.
A list of technical papers, with abstracts and pointers to additional information, is also available. Or you can return to the research projects page or our home page.