GPUView
GPUView is a tool I developed with Steve Pronovost while an intern at Microsoft. Its purpose is to investigate the performance interaction between the graphics applications on your computer, the Windows graphics kernel, the graphics driver, the video cards, and the CPU cores. It gives a very different view than standard profilers such as IceCap or Vtune, and graphics API profilers such as PIX. It is one of the only ways of looking closely at the CPU and GPU interaction, determining whether your application is bound by the CPU, GPU, or both, and what parts need to be rearranged to improve resource utilization. It can offer key insights into questions such as:
- Why are we missing our VSync intervals?
- Are new surface allocations stalling the GPU and causing the frame stuttering problem we are observing?
- Will optimizing our CPU code improve performance, or do we need to reduce the amount of work we send to the GPU?
- Are we sending graphics tasks to the GPU early enough in the frame, or is the GPU idle while waiting on our CPU code?
The first part of this page covers using and understanding GPUView. In the second part I will go over some examples of using GPUView to investigate performance problems in real games.
You can download GPUView as part of the Windows 7 SDK. After installing the SDK you will need to go to C:\Program Files\Microsoft SDKs\Windows\v7.0\bin and run either wpt_x64.msi or wpt_x86.msi. This will install the Windows Performance Toolkit which contains GPUView.
To use GPUView, go to the command line and run Log.cmd to start event logging. Then run Log.cmd again to stop logging. This will generate several Event Tracing for Windows (*.ETL) files; these various streams will all be merged together into a single file called Merged.etl which is what GPUView reads. Some examples of logged events are:
- All CPU context switches, including the stack trace and the reason for switching.
- All kernel mode enters and exits and the stack trace.
- All GPU events as recorded by the DirectX Graphics Kernel, including all command buffer submissions, and resource creation, destruction, lock, and bind events.
- Events reported by the graphics driver, such as command buffer start and end times, and vertical synchronization intervals for each adapter.
- Many other system events that can affect performance, such as page faults.
You can also read ETL files with XPerf (which is likewise part of the Windows SDK), however it will not understand any of the GPU specific events. Because these log files can be relatively large (World of Warcraft generates approximately 1GB every 3 seconds,) I often use the "Log m" command instead which will skip many of the very high frequency events.
As long as the log file can fit in RAM, the overhead of ETW logging is very low; typically game frame rates will change by at most 1 or 2 fps when logging is enabled.
Understanding GPUView
Extensive documentation of GPUView can be found alongside the GPUView installation. Unfortunately, GPUView was designed from the beginning to be a very comprehensive and powerful tool, and this brings great complexity. This complexity has only increased as more teams requested new GPUView features to help them investigate performance problems, such as the video playback team at Microsoft (who are very concerned with frame skipping and CPU usage) and the driver development teams at NVidia and ATI. This complexity makes understanding GPUView very challenging for people who are only familiar with the D3D API viewpoint of graphics and are not familiar with the internals of how these API commands get batched by the operating system and are eventually transmitted to the graphics card.
Windows Vista Display Driver Model
Microsoft redesigned its graphics driver model with Windows Vista and beyond to better support multiple graphics applications running simultaneously. Understanding this model is critical for understanding graphics performance on Windows. First, the OS associates each D3D device in each process with its own graphics context. Each API call sent to the context is batched in a list of commands for that context. When enough commands are built up, or for whatever reason the API feels it needs to flush the current command buffer, the D3D API dispatches a command buffer to the graphics kernel. These command buffers are not processed immediately but are instead stored in a queue for each context. The graphics card has a queue of tasks it is working on. Periodically, when there is room the graphics scheduler will wake up and add a task from one of the contexts with work in its context-specific command queue onto the graphics card work queue. It tries to do this in as fair a manner as possible while avoiding excessive resource thrashing, similar to a CPU scheduler. GPUView will allow us to see, as a function of time, the state of all the context-specific GPU queues as well as the queue for the graphics card. The graphics card is always working on the object at the front of its queue (or is idle if its queue is empty.) Note that GPUView is designed explicitly for this driver model and will not run on Windows XP.
A CPU-only Application
We'll start out by looking at what GPUView looks like for applications with no GPU activity. Below is a trace of me compiling a project in Visual Studio:
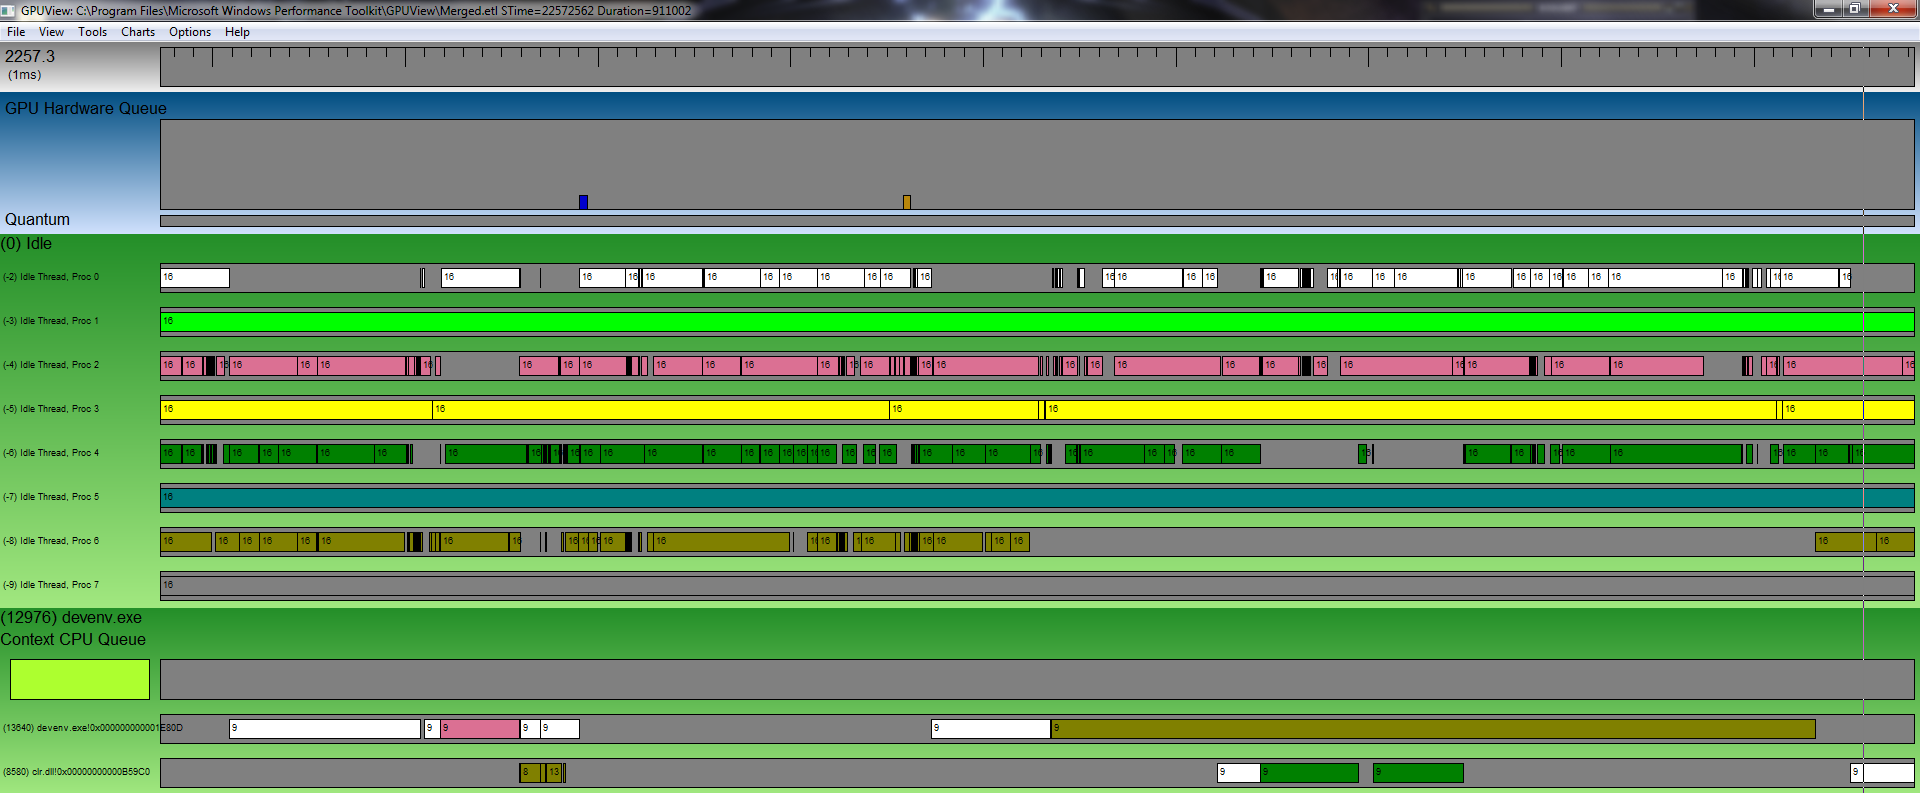
The horizontal axis in GPUView is always time. The timescale of the smallest tick mark on the "ruler" at the top of the screen is given in the upper left. Just below that is the GPU Hardware Queue, which shows what work is currently being processed by the graphics card (largely empty for this trace.) Below the hardware queue is a green rectangle for each process in the system. Within each process, the CPU graphics queue is shown first followed by each thread that belongs to the process. Because there are a lot of threads on the system, GPUView will hide threads and processes that do not appear to be doing a lot of work. The first process shown is always the idle process with a thread for each core on the CPU. At every time interval, each the cores will be working on exactly one thread (if there is no thread with work ready the processor will be in its idle thread.) Each processor is given its own color, so it is easy to see which processor is working on which thread at any time. Processors can context switch between threads for a large number of reasons, such as the thread's execution quantum expires, the thread went to sleep or is blocking on a certain event, or a higher priority thread has work ready.
A Single GPU Application
Here is a trace showing one second of World of Warcraft:
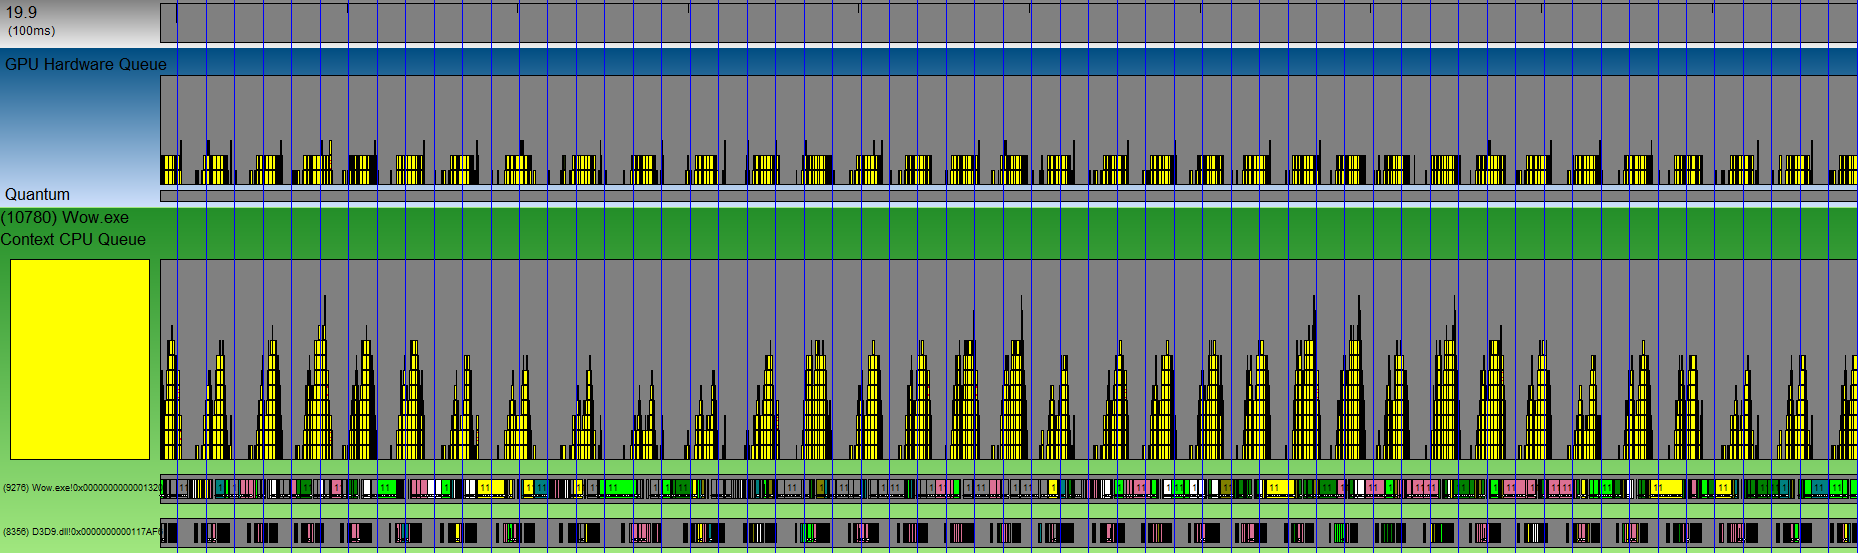
First note the vertical blue lines. These represent VSync interrupts, which are a crucial time interval for investigating graphics performance. VSync intervals provide a good temporal reference point even for applications that are not waiting for VSync interrupts to present to the screen.
GPUView supports symbol lookup to provide meaningful stack traces and thread names. When symbols aren't found the module name and offset are used as a proxy. For example, in World of Warcraft we can see that there is a main thread owned by WoW and an alternative thread created by Direct3D to manage the command buffer submission. If we had the symbols for WoW, GPUView would resolve these symbols to give us the names of the entry point function for each thread.
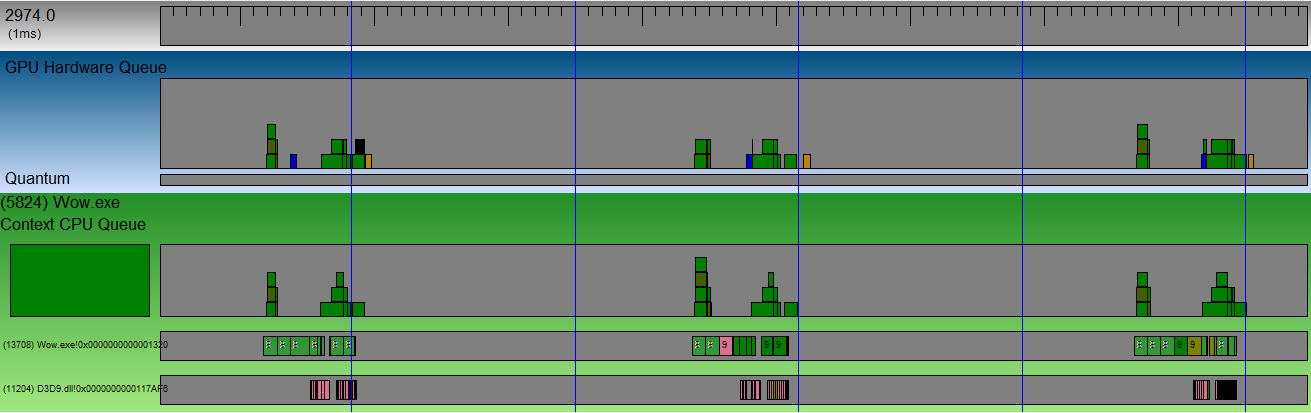
Throughout the interval shown above, WoW's main thread continuously submits work to WoW's CPU queue, and then the operating system uploads work from the CPU queue onto the GPU queue. To see the queue behavior better, below we zoom into approximately three VSync intervals:
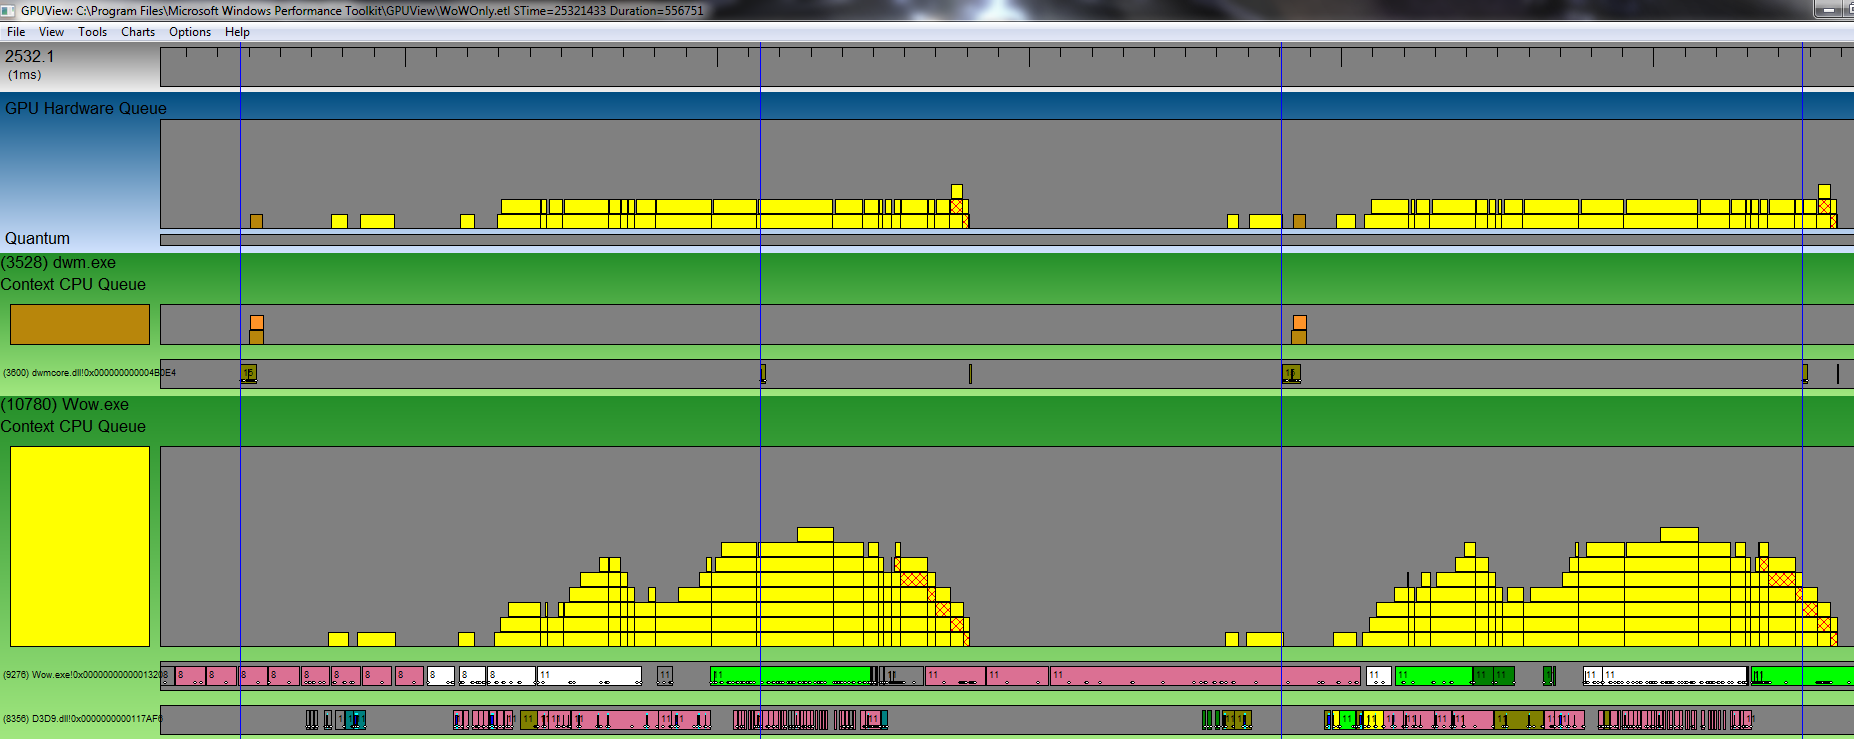
At any point in time, the height of a queue shows the number of packets in the queue, with the oldest packet at the bottom and the newest packet at the top. A packet is usually a large number of API calls collected into a single command stream that is ready for execution on the graphics hardware. The entry at the bottom of the GPU Hardware Queue is the task that is currently being processed by the hardware; if it is empty the GPU is idle during that time. Tasks do not leave the CPU queue until they are actually completed by the hardware.
Some packets have special colors to denote important events. The most important packet type is the present packet, which is denoted by a cross-hatched pattern. If an application that waits for VSyncs wants to achieve 60fps, it must get at least one present packet processed by the graphics hardware during each VSync period.
Note that the dwm.exe process is shown here. This is the Desktop Window Manager for Windows, and will always be running unless you are in full-screen exclusive mode. Looking at the window manager's behavior is important because if your application blocks dwm.exe's present buffer, your application's changes will not be visible to the user (Windows assigns a higher graphics thread priority to dwm.exe, so this should not usually occur.)
A Single Queue Packet
GPUView stores a lot of information about each object. For example, you can click on a queue packet to follow it throughout its lifetime in the CPU and GPU queues, and get other information on it:
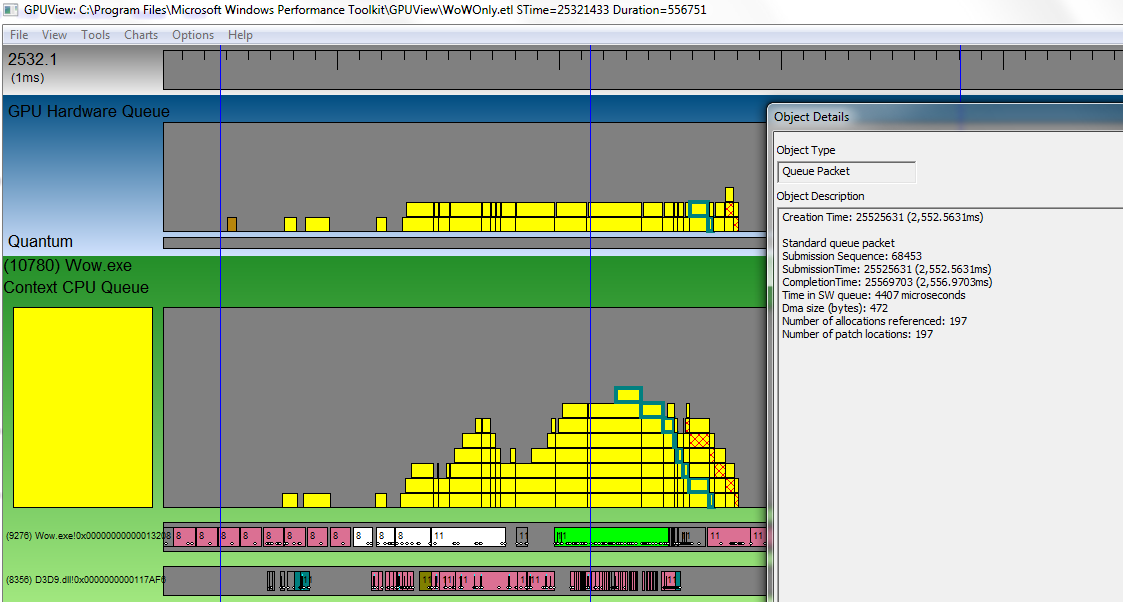
This lets us see exactly how long it takes from when the packet first entered the command queue to when it got executed, which is important when trying to debug unusually high latency. The start time of the packet indicates when the API decided to submit command buffers to the queue. There are functions in Direct3D to force the graphics API to flush the current command buffer; some older games, such as Warcraft 3, have also used techniques like locking the frame buffer to force the graphics API to flush and process the command stream.
Multiple GPU Applications
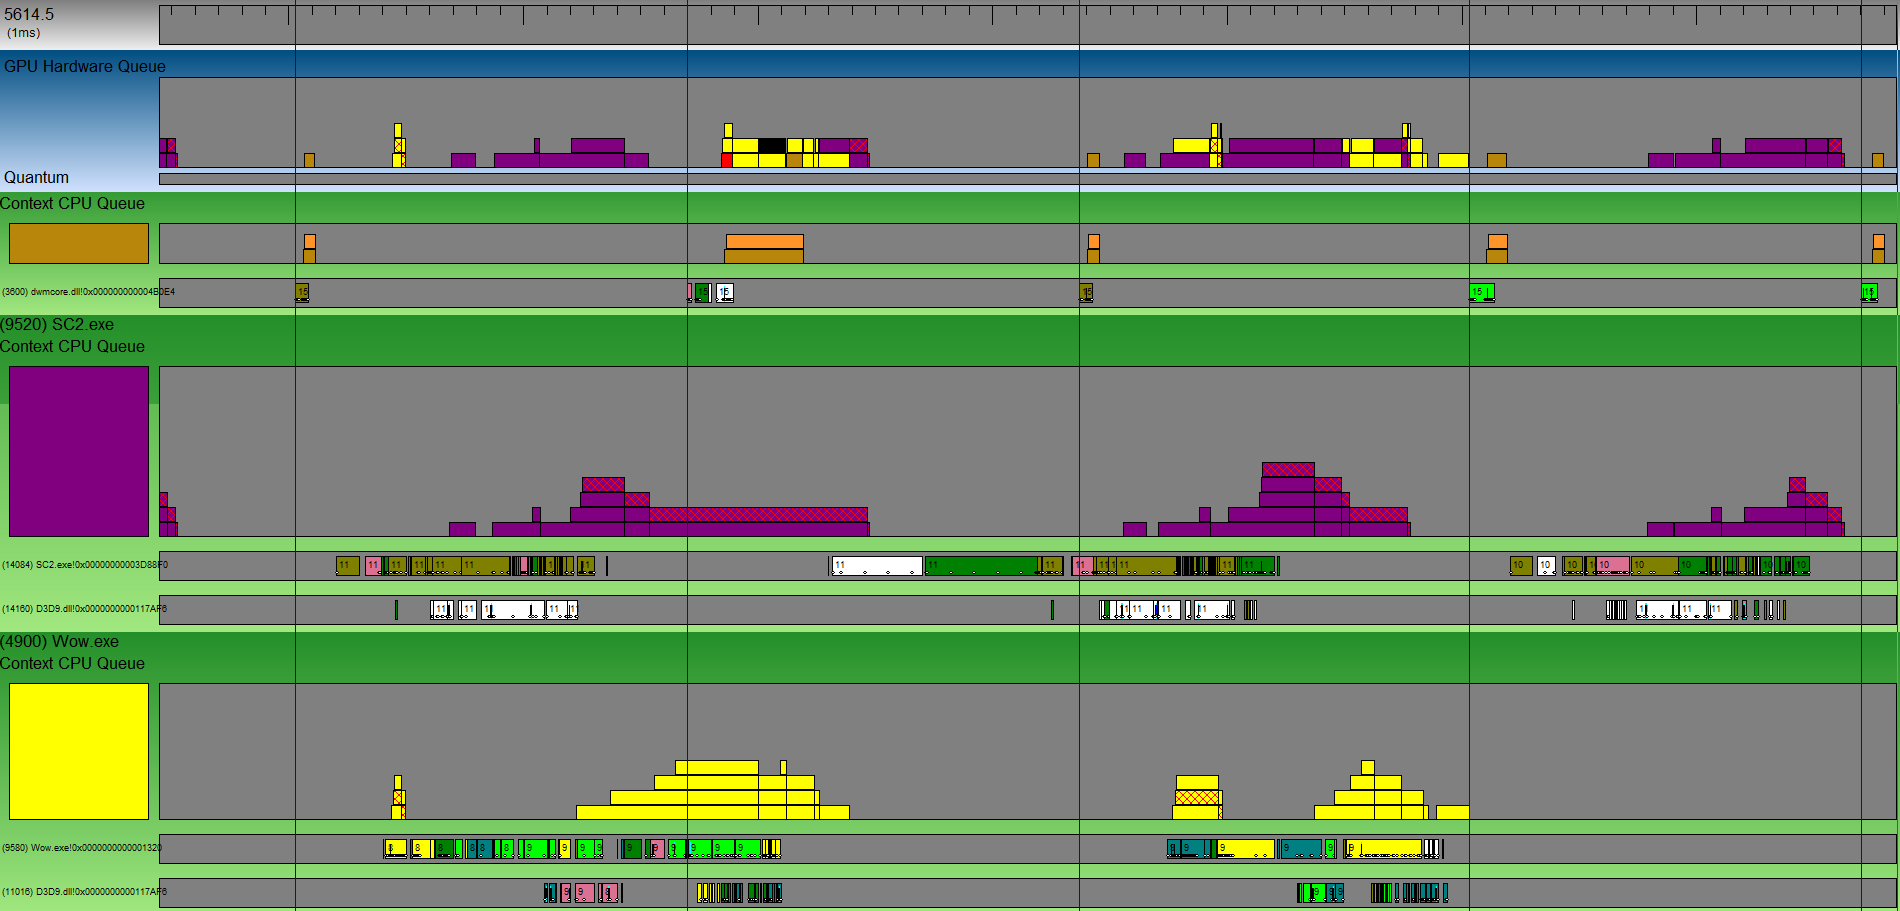
This shows what GPUView looks like when multiple GPU applications are running at the same time. Each CPU Context Queue gets its own color, so it is easy to see which application the graphics hardware is currently working on. Multiple applications fighting for control of the GPU can make tasks that are relatively fast to execute on the GPU have a very long wall-clock time. GPUView makes it easy to see when and how this is occurring.
Diagnosing Problems
Here we'll look at three specific scenarios where poor performance is observed in games and investigate what is causing it.
Large Render Time - Mothership Cloaking
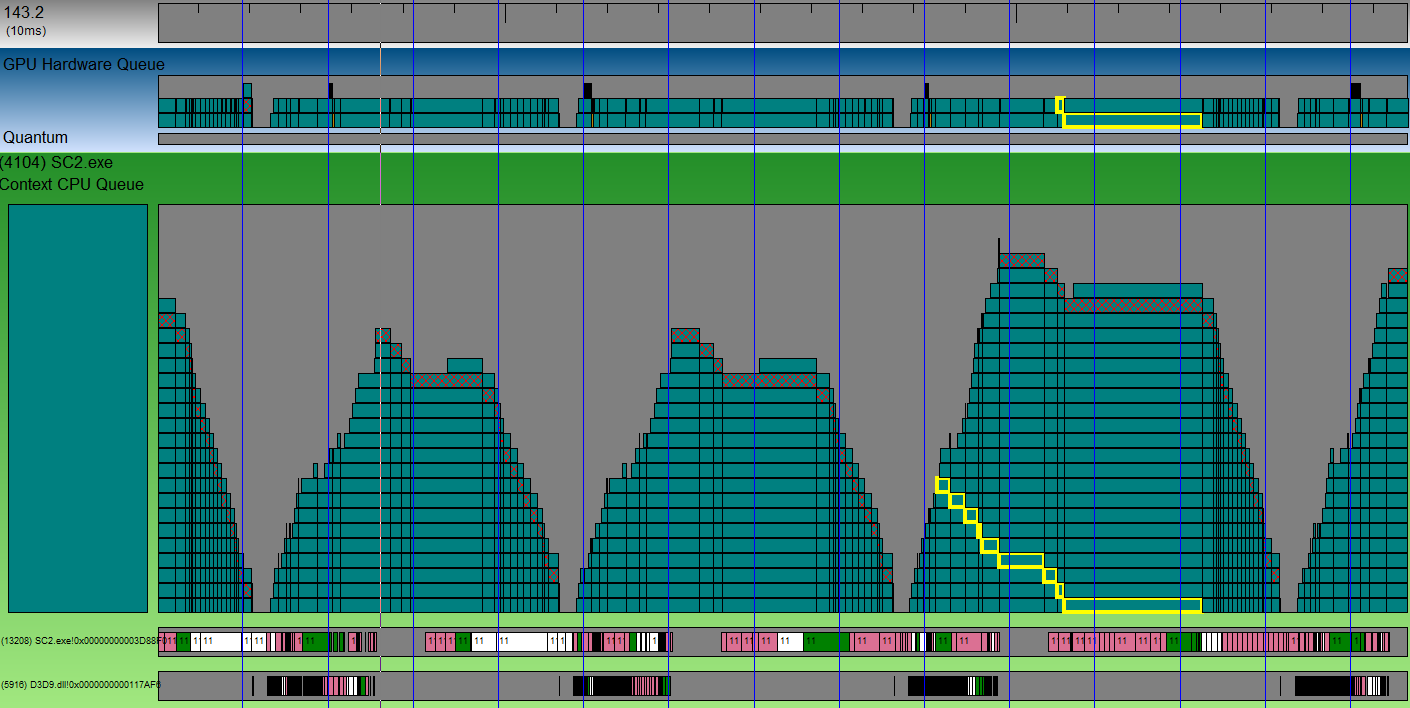
This is SC2 running on Ultra settings where a mothership is cloaking a large number of units. This cloaking effect is notorious for extensively taxing graphics cards. As can be seen from this trace, each frame rendering takes approximately 4 VSync intervals, so the game is running at a very slow 15fps. The problem is clearly due to large render times where a single queue packet alone is taking about two VSync intervals to complete. There is very little GPU downtime (approximately 5ms,) which could be recovered by submitting GPU work more quickly after the present from the previous frame. Other than this, CPU optimizations will be useless and the only way to improve performance is to submit less work to the graphics card.
Large CPU Delay - Dalaran
This is World of Warcraft running on high settings in a crowded part of Dalaran. The application is both CPU and GPU bottlenecked, and certain optimizations to either of these stages could improve performance. The largest problem is that there is a huge delay after the present buffer of the pervious frame and before the bulk of the graphics work is submitted to the GPU for the next frame. This period lasts for almost half a VSync interval and basically guarantees that WoW is unable to obtain 60fps. To fix this, the CPU work could either be deferred so some graphics rendering gets submitted earlier, or the work could be distributed across multiple threads to reduce the CPU delay. Either of these changes could improve GPU utilization and increase the frame rate.
GPUView periodically logs stack traces and allows applications to submit their own events to the log stream to easily determine exactly what CPU work is going on during this period.
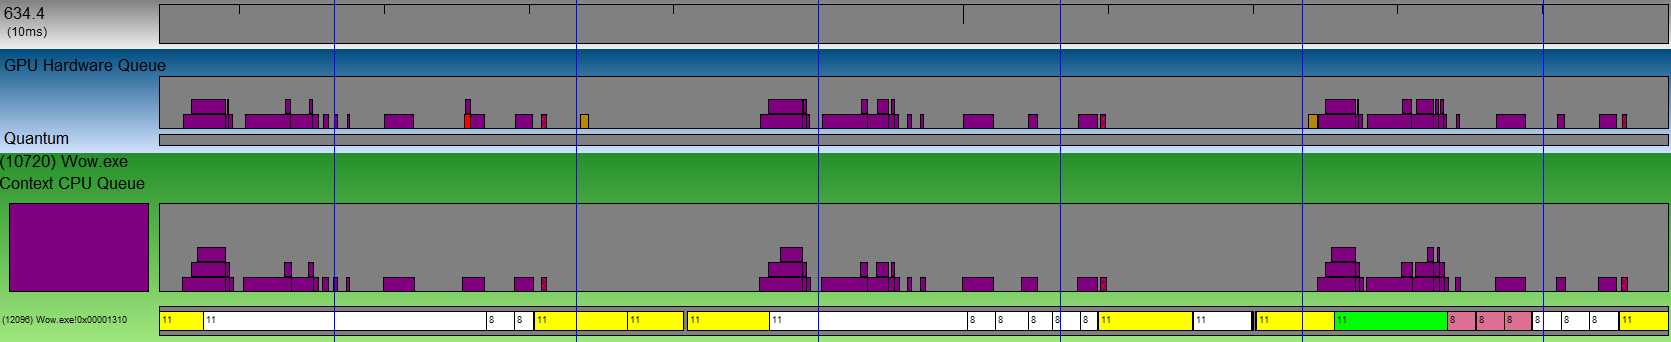
One of the annoying aspects of optimizing applications on the PC is that each user has a different hardware configuration and the performance landscape may be different. Below is the exact same scene in Dalaran as above, except on a computer with a slower CPU and lower graphics settings, running at 25fps. The situation is similar, with the CPU execution time being an even larger factor in determining frame rates. Reducing the amount of work sent to the graphics card will have almost no impact on the frame rate for this computer.
Although only one World of Warcraft thread is shown here, WoW in fact creates many threads and they are also executing some code during these intervals. However GPUView automatically hides them because they have almost no work, and the CPU thread shown above constitutes over 98% of the total execution time for WoW. You can look at this trace to see the execution pattern of the other threads in WoW. If any of these threads are designed to alleviate the workload of the main rendering thread, this trace suggests they are not doing a very good job.
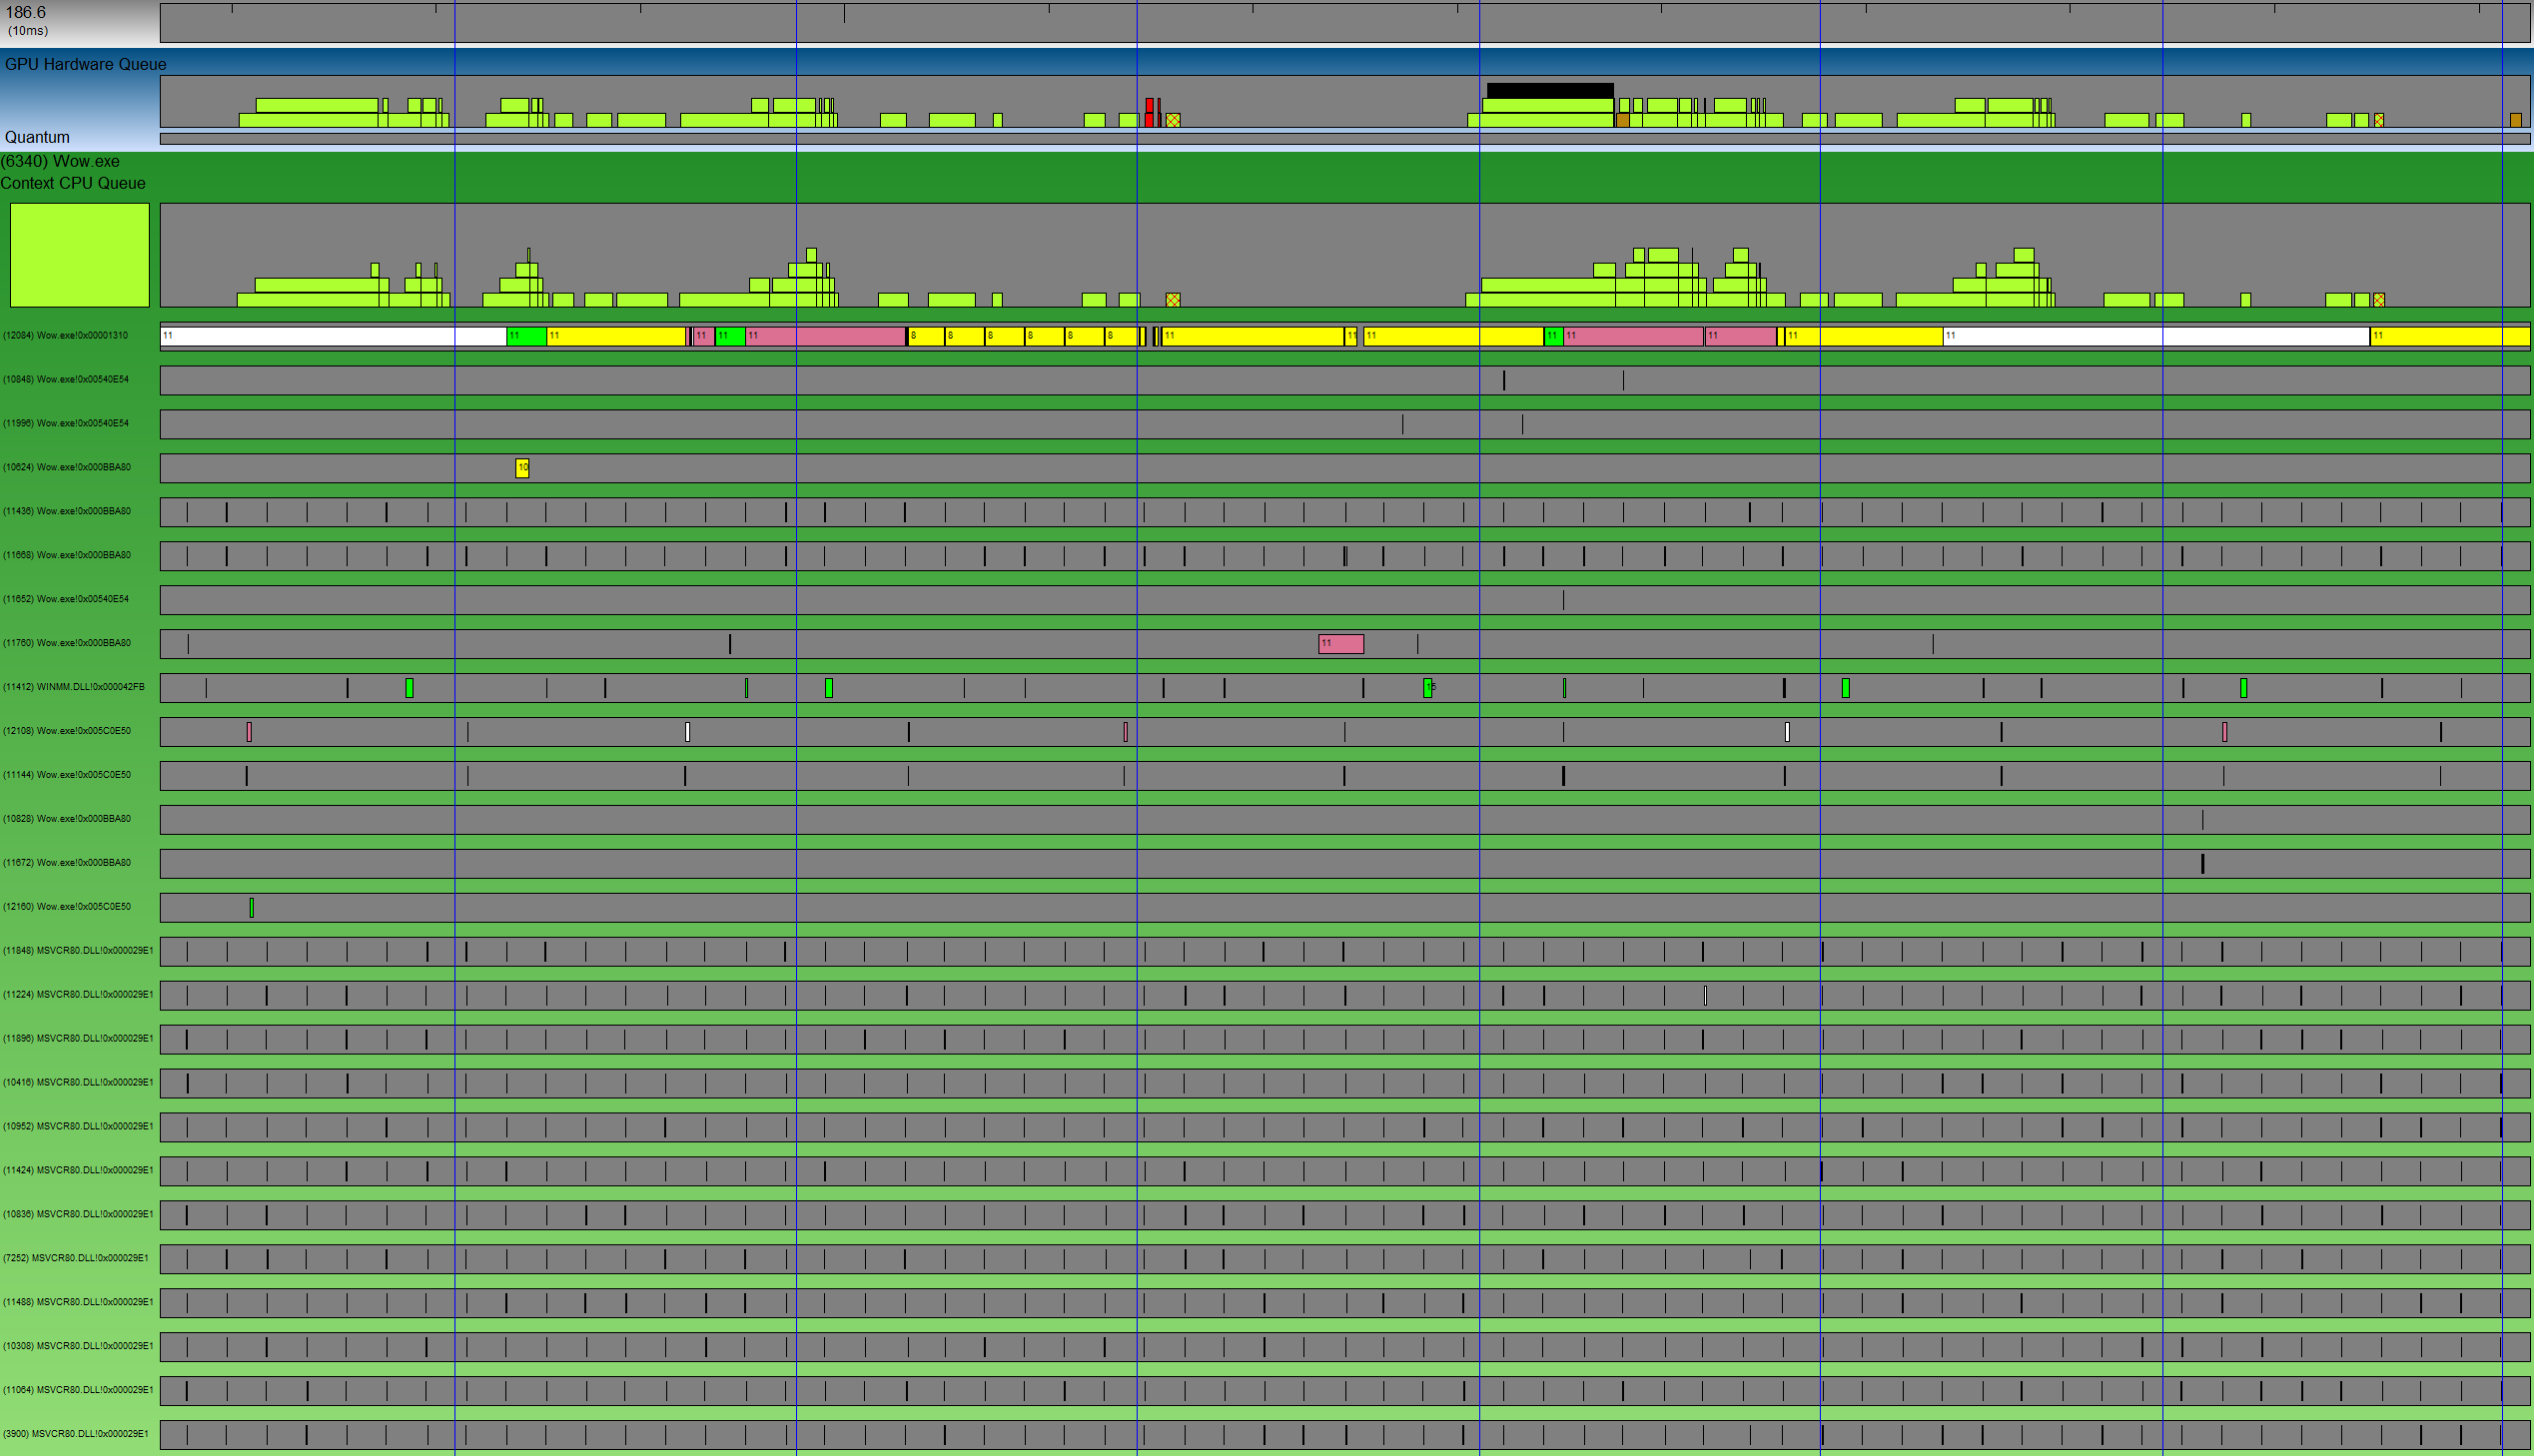
Excessive Sleep - Ironforge
This is World of Warcraft running in a nearly empty spot in Ironforge. Despite the VSync delay period being set to one (60Hz) WoW will periodically run at 30fps. Looking at the trace, we can see that even though the application is not bound by either the CPU or GPU speeds, the WoW render thread is asleep for entire VSync intervals, and thus is neither rendering a new frame or processing user input during these times. Most likely, the thread is sleeping on some event from the graphics API, but there is some miscommunication occurring and WoW is sleeping for longer than it intended to. Looking at the rest of the system threads during this interval, we can see that there are plenty of free CPU cores to run this WoW thread. GPUView logs extra information with each context switch that can help determine what event caused thread to stop being executed.
Event Lists
GPUView logs a massive number of events per second. While a lot of these (such as context switches and queue packet submission events) are aggregated into a visual format that can be parsed relatively quickly, sometimes there are specific events that you might want to examine that have no visual mapping. GPUView lets you directly search the event stream, and has decoders for most important events. For example, a programmer worried about whether allocation creation is causing frame stuttering might want to highlight all the allocation events, so they can zoom into areas where many allocations are being created at once:
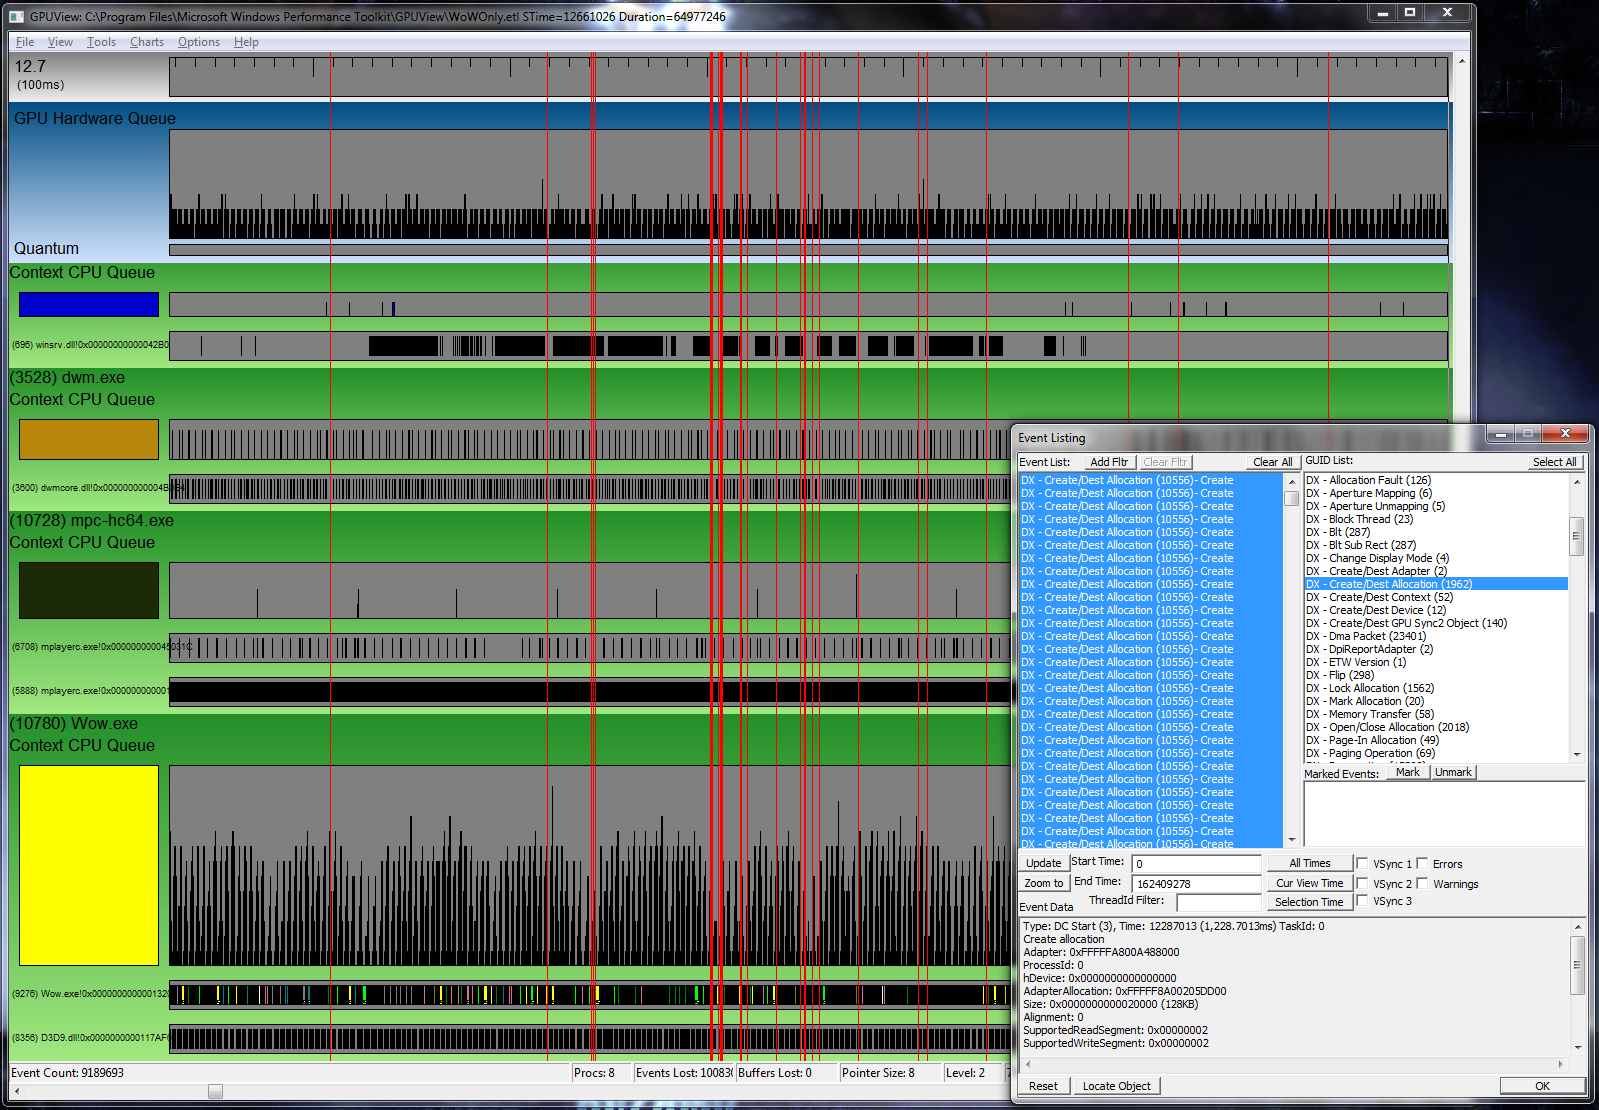
The user can see specific information about each allocation event, such as the size of the allocation and what memory segment it lives in (typically either system memory or video memory).
GPUView also supports a simple DLL plugin model for custom events so the application can correlate the observed streams with known code points, and can decode parameters attached to these user events within the viewer.
Miscellaneous
Here is a PowerPoint presentation I gave at Stanford summarizing GPUView and comparing it against what you can see with profilers or PIX. Here is a PowerPoint presentation given by Steve Pronovost that describes some features of GPUView.
Although I wrote a large portion of GPUView, after my internship was over full-time employees were brought on to maintain the project.