Nick Parlante 7/2012
< Nick's Home
< Nick's Geiger Counter Page
Here's some simple free software I've written for the Mighty Ohm Geiger Counter. This is version 1.0, released under the Apache license v2.
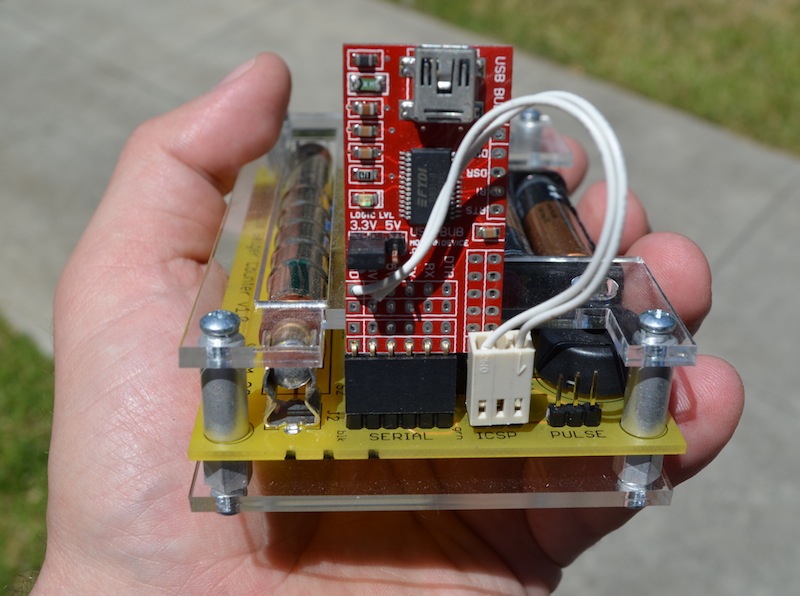
I used the inexpensive Modern Device USB BUB FTDI to connect the geiger counter to a computer. The USB BUB board has a 3.3v supply (any FTDI board will probably have this), so I made up a little cable that carries GND/3.3v over to ICSP GND/VCC pins on the geiger counter. The result is that when you plug it in, the geiger counter just starts running, disregarding the battery power on/off switch so you can just leave the batteries in. Note that on the BUB, the 3.3v is not by default carried down as power to the black serial connector. By putting the power on its own connector, the original un-powered function of the serial connector is preserved.
I don't know if this is the best way to power the geiger counter from the USB adapter, but it seems to work great. I've run the geiger counter for over 24 hours this way. Since the 3.3v supply is a little higher than the standard 3v battery supply, ideally you want to re-do the calibration of the geiger tube voltage. As a practical matter, the change in supply voltage made less than a 10% difference in the tube voltage.
I thought I might use the geiger counter as a source of data for some sort of CS assignment, and of course hacking around with it was just a way to procrastinate whatever I was supposed to be doing. In particular, many household objects, such as bananas for example, have significant (although safe) radioactivity. The data is very noisy and the banana radioactivity is very low, but it looks to me that if you aggregate enough data, you can tease out the banana signal. I have not worked that through rigorously though.
I thought you could have an assignment where the student code has to look through a bunch of data traces and figure out which trace goes with which objects. Or have a big long data trace, and the student has to figure out for which 1 minute interval the banana was there. The data is extremely noisy, so that gives some CS/algorithm/math appeal. Anyway, at this point I've just played around with it.
I ended up writing a simple command line program released here - mrgeiger.py - to process the data.
In particular, mrgeiger.py lets you "group" the data into periods of 10 seconds or 60 seconds or whatever, computing CPM etc. for each group and also for the whole run, which was what I wanted for the labs. Here's an example from the README so you can see what it does:
**Example 1**
Group data by 20 seconds, ending at 120 seconds,
write the csv data to afile.csv as well as stdout:

mrgeiger.py -i /dev/cu.usbserial-A9007CPG -g 20 -t 120 -o afile.csv

seconds, count, cpm, uSv/hr
20, 6, 18, 0.1026
40, 7, 21, 0.1197
60, 4, 12, 0.0684
80, 9, 27, 0.1539
100, 11, 33, 0.1881
120, 8, 24, 0.1368
total seconds:120 count:45 cpm:22.5 uSv/hr:0.12825
See the full README.txt for the details.