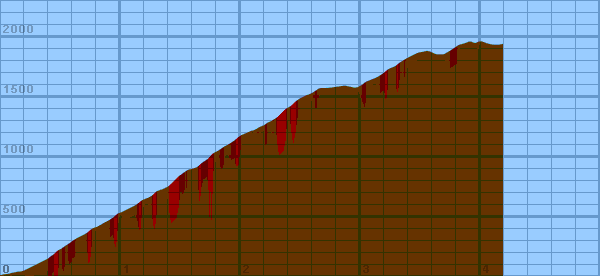
Dan Connelly describes it well:
This is really, really, hard on standard road gears. The listed stats show a steep average grade of 8.9%, but there is a considerable flat section at the top, so it is actually much worse than this. A low gear of 39/28 or lower really helps here. On Orbit Dr is an alternate route which bypasses a section of Bohlman. To capture the full effect of this climb, On Orbit should be taken, as it includes significant sections at near 20%.
From the top of Bohlman, if you survive, there is a 0.9-mile dirt road to the right (bear right on the dirt) to the top of Montevena Road, which can be descended to Highway 17. A short trip to the right along Hwy 17 brings one to Black Road, which can be climbed to Skyline Road. After B-O-B, the 10% grades of Black Road are cake.


Overall (averaging my first 20 hills), the gradiometer grade averages 0.63 (% grade) higher than the altimeter grade, with a standard deviation of 4.5 (% grade per road). This error may be due to:
Dist    Grade   Alti.   Location
----    -----   ------  --------
0.00     1%	 640	start - 6th street
0.04	 4%	 650
0.07	 1%	 650	sister of Notre Dame
0.09	 8%	 660
0.11	 5%	 660
0.14	 4%	 670
0.17	 4%	 670	Hidden Valley Lane
0.20 	 6%	 680
0.22	 9%	 690
0.24	 5%	 700
0.26	10%	 710
0.28	13%	 720
0.30	14%	 730	Norton Road
0.32	11%	 740	sign: slow, one lane road ahead
0.34	12%	 750
0.36	11%	 760
0.38	10%	 770
0.40	11%	 780
0.42	13%	 800	left turn
0.44	16%	 810
0.46	12%	 830
0.48	13%	 850
0.51	14%	 860	sign: no parking any time
0.53	13%	 880	signpost: (sign missing)
0.55	12%	 890
0.58	13%	 910
0.59	12%	 920
0.61	13%	 930
0.62	12%	 940	right turn
0.64	13%	 950	15210 Bohlman
0.66	12%	 960
0.68	10%	 970
0.70	13%	 980
0.72	13%	 990
0.74	20%	1010	right turn -- 16% on the outside -- 15270 Bohlman
0.75	11%	1020
0.77	10%	1030
0.79	12%	1040
0.80	11%	1040
0.82	11%	1050
0.83	12%	1060
0.84	18%	1060	right turn -- 16% on the outside -- 15280 Bohlman
0.85	11%	1070
0.87	11%	1080
0.89	14%	1090
0.91	13%	1100
0.92	11%	1110
0.94	12%	1120	Kitridge Road
0.95	18%	1130	right turn -- 10% on the outside
0.96	12%	1140
0.97	12%	1150
0.99	11%	1160	1535 Bohlman
1.00	12%	1160	left turn -- 20% on the inside
1.02	11%	1170
1.04	12%	1180
1.08	 9%	1200
1.10	13%	1210
1.12	10%	1220
1.15	10%	1240
1.17	13%	1260
1.19	11%	1270
1.22	11%	1280
1.24	11%	1290	Belnap Way
1.26	17%	1300	straight
1.27	17%	1310	straight
1.28	16%	1320
1.29	 8%	1330	right turn
1.30	 7%	1340
1.33	 8%	1350
1.36	 8%	1360
1.38	11%	1370	Archibald Road
1.40	16%	1380	left turn (23% inside)
1.42	14%	1400
1.43	16%	1410
1.45	19%	1430
1.46	18%	1440	15515 Bohlman
1.47	24%	1450	right turn - 18% on the outside
1.48	20%	1460
1.49	15%	1470
1.51	12%	1480
1.52	14%	1490
1.53	15%	1500
1.54	18%	1500
1.55	16%	1510
1.56	 0%	1520	left turn -- 15525 Bohlman
1.57	 4%	1520
1.61	 4%	1530
1.64	 8%	1540
1.65	16%	1550
1.66	16%	1560
1.67	14%	1570
1.70	13%	1590
1.73	15%	1610	sign: ICY
1.75	16%	1630
1.75	 9%	1640	On Orbit (lower)
1.76	10%	1650
1.78	15%	1660
1.80	13%	1670
1.82	12%	1680
1.86	12%	1710	15555 Bohlman
1.90	12%	1730
1.93	10%	1750
1.96	15%	1770
1.98	13%	1790
2.01	10%	1810
2.04	 6%	1820
2.06	 9%	1830	15666 Bohlman
2.08	 6%	1840
2.12	 7%	1850
2.15	 8%	1870
2.17	13%	1880
2.20	11%	1890
2.22	13%	1910
2.25	12%	1920
2.28	11%	1940
2.30	13%	1950
2.32	14%	1970
2.34	16%	1990
2.36	16%	2010	15999 Bohlman
2.38	15%	2030
2.40	14%	2040	On Orbit (upper)
2.41	14%	2040
2.44	14%	2070
2.46	13%	2090
2.49	12%	2110
2.51	 9%	2120
2.55	 6%	2140
2.58	 8%	2150
2.60	12%	2160
2.63	13%	2180
2.66	15%	2200
2.68	11%	2200
2.69	 0%	2200
2.73	 -1%	2200
2.80	 2%	2210
2.87	 -3%	2220
2.96	 0%	2200	16200 Bohlman
2.98	 7%	2210
2.99	16%	2210
3.00	16%	2220
3.02	13%	2230	right turn
3.04	 8%	2250
3.09	 8%	2270
3.14	 8%	2290
3.17	14%	2310
3.20	 9%	2330
3.22	13%	2350
3.24	13%	2360
3.26	 9%	2370
3.29	 8%	2380
3.31	12%	2400
3.34	11%	2420
3.36	11%	2430
3.37	14%	2440
3.39	12%	2450	16641 Bohlman
3.43	 8%	2470
3.45	10%	2480	Bay Springs Road
3.47	 5%	2490
3.50	 1%	2500	16654 Bohlman
3.52	 6%	2500
3.55	 4%	2510
3.56	 0%	2510
3.59	 -6%	2500
3.63	 -6%	2480
3.64	 0%	2480
3.70	 0%	2480	sharp right turn
3.71	16%	2490	16830 Bohlman
3.73	13%	2500
3.76	12%	2520
3.79	 6%	2540
3.82	 7%	2560
3.86	 9%	2570	16960 Bohlman
3.89	 7%	2580
3.91	 0%	2590
3.94	 -9%	2580
3.96	 0%	2570
3.97	10%	2580
3.99	 8%	2590
4.01	 0%	2590	Mc Gill Road
4.03	-7%	2580	Gravel, rocks on road
4.06	-4%	2570
4.11	 0%	2560
4.16	 4%	2560
4.19	 3%	2570	sign: END