Redwood Gulch Road, Saratoga map

Statistics:

Max. grade: 18% (21% inside sharp right turn)
Main climb:
Avg. grade: 9.7% (elev. gain/dist)
Length: 1.35 miles (2.17 km)
Elev. gain: 690 feet (210 m)
Entire profile:
Avg. grade: 9.3%
Length: 1.43 miles (2.30 km)
Climb: 690 feet (210 m)
Descent: 10 feet (3 m)

Description:

Redwood Gulch climbs from Stevens Canyon up to highway 9, mostly under the cover of tall redwoods and other trees. The initial 7% grades, gorgeous scenery, and low traffic may lull you into a serene peace, before the brutal 17+% grades wake you from your dreams.

I thought I had the answer to such grades -- a 30-tooth chainring. However, the hill countered with slick, wet pavement. With each pedal stroke, my rear tire would spin, while my bike barely inched forward. Apparently, the plentiful shade, dampness in winter, and low traffic volume combine to allow a thin layer of slick moss to grow on the road. I had to shift up a few gears to maintain traction.
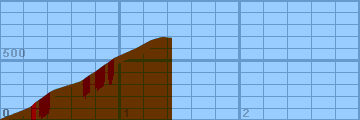
Altimeter altitude

(Altitude linearly interpolated from altimeter samples, and smoothed with a 0.04mi gaussian.)

Each horizontal line is 100 feet. Each vertical line is 0.2 miles.

Gradiometer grade

(Grade linearly interpolated from gradiometer samples, and smoothed with a 0.04mi gaussian.)

Each horizontal line is 2% grade. Each vertical line is 0.2 miles.

Altimeter grade

(Grade linearly interpolated from altimeter samples, and smoothed with a 0.20mi gaussian.)

Each horizontal line is 2% grade. Each vertical line is 0.2 miles.

Comparison of grades

(Green grade is from the gradiometer, magenta grade is from the altimeter, and white is where they overlap.)

Each horizontal line is 2% grade. Each vertical line is 0.2 miles.

Overall (averaging my first 20 hills), the gradiometer grade averages 0.63 (% grade) higher than the altimeter grade, with a standard deviation of 4.5 (% grade per road). This error may be due to:

In the end, though, I think that each individual sample is accurate to within about 2% for that instantaneous segment of road. My results may not always agree with my altimeter, but they are generally repeatable within 1%. I think that I just need to take more samples to generate more accurate graphs.

Raw Data:

Dist    Grade   Alti.   Location
----    -----   ------  --------
0.00    11%     820	start - Stevens Canyon - short bump      
0.01     8%     830	flatter now                              
0.14     7%     880	"No Parking" sign nailed to redwood      
0.24     7%     920	first right turn -- getting steeper      
0.27    17%     940	approaching sharp right turn             
0.28    21%     960	sharp right turn -- 13% on outside       
0.30    17%     970	beyond right turn -- steady grade        
0.33    18%     990	approaching left turn -- tire slipping!  
0.37    17%    1020	beyond left turn                         
0.41    15%    1050	starting to ease now                     
0.45     6%    1070	flatter now, patch of sunlight  
0.64	 6%    1130	-- added point to fix missing data --         
0.67    12%    1140	houses now, shady -- getting steeper     
0.74    14%    1190	beyond left turn -- slipping again       
0.79    16%    1220	beyond right turn                        
0.87     8%    1280	brief break (30 yards)                   
0.89    16%    1290	climbing again                           
0.94     8%    1330	leveling out                             
1.14     9%    1420	slightly steeper                         
1.25    15%    1480	orange sign, "one lane road ahead"       
1.28     4%    1490	yellow sign, "one lane road ahead"       
1.35    -5%    1510	patchwork pavement, big potholes         
1.43     1%    1500	end - Highway 9                          


Back to Lucas's cycling gradiometer page.