| A Code Fragment |
|---|
|
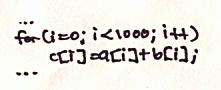
| Figure 1: A code fragment which loops to add the contents of one array to a the contents of a second array, storing the result in a third array. |
| See also: |
"Critique
of Visualizing Memory Hierarchies," by Nolan Glantz, and "Comments," by Edward Chang. |
This paper proposes a set of tools which allow a programmer to analyze and visualize a program's interaction with a computer system's memory hierarchy. Five tools are introduced: the Static Main Memory Display, the Dynamic Main Memory Display, the Static Cache Display, the Dynamic Cache Display, and the Memory Cell History Display. These tools allow a programmer to observe cache and main memory behavior from trace data, and allow the programmer to easily extract a variety of performance-related data.
Part of writing a computer program is writing efficient code. Real-time applications, such as graphics programs, interactive simulations, and computer games, and computationally intensive applications, such as large-system simulations, must all run efficiently. Moreover, the capabilities of such programs are usually limited by their efficiency--that is to say, making these programs more efficient allows them to do more.
One aspect of making a program efficient is making the program's memory accesses efficient. For some systems, this task is fairly straightforward; however, as programs and computer systems become more complex and less predictable, many factors, such as multiple levels of caching, superscalar processor architectures, multiprocessor environments, and unpredictable program input, increase the difficulty of making memory accesses efficient. For systems such as these, when memory efficiency is a concern, there is a need for having tools to analyze and visualize a program's memory accesses.
Surprisingly little work has been done to satisfy this need for such tools. From my library and WWW searches, I was able to find only one related paper. The paper discussed the Memory Hierarchy Framework [1], which is essentially a model for understanding the principle components of a memory hierarchy. The paper described how the model could be used to understand memory architectures and how such knowledge could be used to write better programs. While the model suggested by this paper might be a useful learning tool, it offers little in the area of improving a complicated program's memory efficiency.
The lack of tools for analyzing and visualizing a program's interaction with a memory hierarchy provides some of the motivation behind this paper, which proposes five new memory behavior analysis tools. The tools are simple in concept and aim to provide an easy-to-understand overview of a program's memory behavior given a trace of the program's memory accesses.
A number of issues arise when developing memory analysis tools. The first section of this paper discusses a number of these issues, while the second section of this paper discusses the new memory analysis tools. The final section of the paper gives an example of how the tools might be used.
Perhaps the greatest problem in visualizing a program's interaction with a memory hierarchy is accurately determining what memory accesses the program makes and how these accesses interact with the memory system. The primary difficulty with this task is collecting the data in a way which does not disturb the collection process and the resulting data. Often, the temptation is to add extra code to a program to collect statistics; however, this approach fails when trying to accurately record a program's memory behavior, because the act of collecting the data affects the data collected.
One way to solve this difficulty is to use a program such as SimOS [3]. This system simulates a complete computer system, and allows one to take measurements from a simulated system rather than an actual system. By simulating a program running on a particular memory system, the program and its memory behavior are not affected by the measurements taken. Moreover, with such a system, almost any aspect of the memory system, or the computer system in general, can be monitored.
With the necessary simulation technology, it becomes possible to ask the question of what data to collect.
As explained by [2], the purpose of a memory hierarchy is to provide a memory system with the price of the cheapest type of memory and with the speed of the fastest type of memory. The driving principle behind such a system is the concept of locality, which states that a program accesses its code and data non-uniformly. The result is that code and data that are likely to be used soon may be stored in faster memories while code and data that are not as likely to be used soon may be stored in slower memories.
Typically, a memory hierarchy works as follows: when a memory location is accessed, its contents are placed into the highest level of the memory hierarchy, with the hope that the contents of the memory location will be accessed again in a short period of time. As new locations are accessed, new pieces of code and data are brought into the higher levels of the memory hierarchy, replacing the older pieces of code and data, which fall back to the lower levels of the hierarchy. Two concepts which are important in such a system are hits and misses. A hit occurs when a piece of data is found at a particular level of the hierarchy, saving an access to the next lower hierarchy level. A miss occurs when a piece of data is not found at a particular level of the hierarchy and the next lower level in the hierarchy needs to be accessed. Hits imply time saved, and misses imply time lost. Maximizing the number of hits and minimizing the number of misses is central to making a program run efficiently, and therefore, the visualizations I propose focus on the numbers and locations of the hits and misses during the execution of a program.
The hit and miss data for a program can be adequately captured in a trace file which contains a listing of all of the memory requests made by a given program and data specifying what level in the memory hierarchy had to be accessed in order to satisfy each of the requests. Additional information may need to be stored to relate the trace data to real variables and lines of code in the program. It is assumed that the simulation system has the capability to annotate the memory trace with this information.
Before explaining how an annotated trace may be used to drive visualizations, it is first necessary to discuss two display-related issues, how to display memory and the difference between static and dynamic displays.
Memory is easily understood as a linear array of cells, where each cell represents a memory location. While a linear representation of memory is convenient, it does not map well to the screen, as such an array is narrow in one dimension and long in the other. A more practical representation is to display memory as a two-dimensional array of cells, where each row corresponds to a block of successive memory locations and where adjacent rows represent adjacent blocks.
In order to emphasize the relationships between the various levels of the memory hierarchy, one may choose to set the width of a two-dimensional memory display such that it is has the same size as the next level up in the hierarchy, or perhaps some power-of-two fraction of the size of the next level up in the hierarchy. For example, one might choose the width of an L2 cache display to be 512 units wide if the L1 cache holds 4K of data. This would allow every eight rows of the L2 display to correspond to a set of data which fits perfectly into the L1 cache, and might reveal interesting patterns in the organization of the L2 data.
One of the difficulties of displaying memory is that the amount of memory to be displayed might be very large. A reasonably-sized program might require tens of megabytes of memory, while a typical display might be able to display only one million pixels. Some means of dealing with programs of a reasonable size is required. One method for dealing with such complexity is to represent several adjacent memory locations together. For example, rather than considering a byte to be the fundamental unit of display, one might instead choose a word or a cache line to be the fundamental unit. Another method for dealing with this sort of complexity is to have a window with a drawing area larger than that of the screen, and to allow the user to smoothly scroll through this drawing area to see different parts of memory. Allowing the user to split the window into two or more sub-windows so that the user may see and scroll through two disjoint pieces of memory would increase the effectiveness of such a display. Combining a variably-sized fundamental display unit with a scrollable display can also be an effective option.
In order to divide the space of possible visualizations, I make a distinction between static visualizations and dynamic visualizations. A static visualization is one which does not consider changes over time. Such a visualization is based on an accumulation of data collected during the execution of a program and attempts to summarize the data in a single view. In contrast, a dynamic visualization is one which focuses on changes over time. This type of visualization makes use of only a portion of the data collected during the execution of a program, namely the data collected during a specific period of time which is small compared to the total execution time of the program. In the context of this paper, a dynamic visualization can be thought of as an animation which can be played at any speed starting from any point.
While making the distinction between static and dynamic views of the collected data, it is important to note that the static and dynamic views are not separate, and that in fact, useful conclusions can be drawn by combining both static and dynamic views of the same data. I will address this issue at the end of this paper.
Given an annotated trace file as input, I propose five displays of the trace data that can be used to analyze a program's interaction with a memory hierarchy. In order, they are the Static Main Memory Display, the Dynamic Main Memory Display, the Static Cache Display, the Dynamic Cache Display, the Memory Cell History Display.
The static main memory display takes trace data from a program and produces a static display which summarizes the program's accesses to main memory. The visualization begins with a single display of main memory arranged as a two-dimensional array, where each pixel (or block of pixels) represents, by default, a block of memory (a memory cell) equal in size to one cache line. The array is initially ordered to represent virtual memory as seen by the program.
The user has the option of specifying what information is displayed in the memory cells. The choices include:
All of these options make use of the intensity of the cell to indicate a value, unless otherwise indicated.
By dragging the mouse over any cell, the user gets to see all data available about the cell, including values for each of the choices listed above, in numerical form off to the side of the display. Moreover, since a cell may represent more than one word of memory, the side display breaks the cell down into its constituent words. By clicking on any cell, the user brings up a memory cell history display, which gives a detailed timeline of the access history for a given memory cell. Highlighting a region on the history display selects a period of time, and this selection may be used to drive any of the dynamic displays. Moreover, the region may be used to recompute a new static display, based only on the period of time highlighted. Dynamic displays and the memory cell history display are discussed in more detail below.
In order to navigate the display, which could be potentially large, the user can adjust a number of parameters, including the width of the display (which is constrained to be an integer power of two), the amount of memory represented by each memory cell, and the size of each memory cell (in pixels). The user is free to scroll the display to view memory not currently visible, and the display can be split to show more than one region of memory at a time. A zoom window allows the user to focus in on a small region of the display which still retaining some amount of global context.
One feature of the static main memory display is the ability to highlight L1, L2, and page boundaries. This allows the user to see which regions of memory might cause various types of conflicts. Moreover, the user may reorder the display based on these L1-aligned, L2-aligned, and page-aligned regions of memory. For example, the user may choose to order the display to show the L1-aligned regions causing the greatest total miss penalties, or the user may choose to order the display to show the L2-aligned regions which caused the greatest number of misses in a specific L2-aligned region. These feature would allow the user to quickly track down memory conflicts.
One potential problem with the static main memory display is that it may be hard for the user to relate virtual memory addresses to names of variables or lines of code. This problem is made more difficult by the fact that a given memory location can be used to store more than one value during the execution of the program. The solution to this problem is to annotate the trace data, as mentioned previously. This allows a list of line numbers and variable names to be displayed as the user moves the mouse over memory cells. If the list contains variable names, then giving the user the option of sorting the list by time, by total miss penalty, or by other categories can help the user track down problems in memory access patterns. The user can also be given the option to click on a name in the list and see related values, for example, the other values in an array if the user the name of a single array element.
An example of a Static Main Memory Display can be found in the Examples section, below.
The dynamic main memory display is similar to the static main memory display, except that it shows variables which change over time. The layout and key features of the static display are also present in the dynamic display, including the overall layout format, the ability to view detail data by dragging the mouse over a cell, the ability to adjust the size of the display, the ability to scroll the display, the highlighting and sorting features, as well as the memory cell-to-name features. Some of these features behave slightly differently with the dynamic display, but for the most part, they operate in the same manner.
The primary feature of the dynamic display is its ability to animate the variables which change over time, namely:
An additional display combines the notions of hitting and missing with the duration since the last access. For example, one could color hits blue and misses red, and each time a miss or a hit occurred, a memory cell would light up either red or blue. The cell would decay at an adjustable rate over time. The light emission would be additive, so that if more than one hit or miss occurred in a short amount of time, the cell would appear brighter than if only one hit or miss occurred.
An extension to the decaying hit/miss display is the decaying hit/miss with decaying lines of conflict. A line of conflict is simply a line which is drawn whenever a piece of memory is removed from a particular level of the memory hierarchy. The line is drawn between the piece of memory which was removed and the piece of memory which replaced it, and the line decays with time in the same manner that hits and misses decay. For a large array accessed linearly, the L1 lines of conflict would appear as a series of short, vertical lines separating pieces of memory separated by the L1 cache size. For more complicated access patterns and for simultaneous access to more than one data structure, the pattern of the lines will hopefully give the viewer some insight into the reasons for the conflict. Lines of conflict can also serve as a means for quickly determining which regions of memory conflict with one another.
The highlighting features described for the static display are augmented with the ability to give information relating to which pages are mentioned in the TLB, which pages are not mentioned in the TLB, which pages are currently resident in physical memory, and which pages are currently on disk. This information can be displayed by adjusting the color of the page boundary highlight.
The naming features are also enhanced when using the dynamic main memory display. With the dynamic display, regions of memory can be outlined and labeled using the name of the variables they currently store. For some variables, this may be done automatically by analyzing debug information, and for other variables, this may require explicit annotation by the user at trace-generation time. However the labeling is accomplished, the availability of names for regions of memory will assist the user in determining what data structures conflict with one another.
In order to navigate effectively through time, the user may adjust the speed of the animation, or the user may choose to "watch" a particular set of memory cells and step to the next time when a value on one of those cells changes. In addition, the user may bring up the memory cell history for any memory cell simply by clicking on it. As mentioned previously, and to be discussed in more detail later, the memory cell history shows a timeline of all activity for a given memory cell. Once the memory cell history view has been selected, the user may then jump to a specific time along the history, or the user may select a region of time to animate. The user may also bring up a static display based only on the period of time highlighted.
An example of a Dynamic Main Memory Display with lines of conflict can be found in the Example section, below.
The static cache display is very much like the static main memory display, except that the displayed information relates to cache data, not main memory data. There are two primary differences between cached data and main memory data. First, a memory cell in a cache maps to more than one main memory cell, while a main memory cell only maps to one (or a few) cache locations. Secondly, caches can be set associative, which complicates the cache display.
Because a cache memory cell maps to more than one main memory cell, the cache display is more limited than the main memory display. For example, it makes sense to talk about the total number of L1 misses attributed to a specific main memory cell, but it doesn't make as much sense to talk about the total number of L1 misses attributed to a specific L2 cache cell, since L2 cells don't cause L1 misses, rather, the main memory cells represented by an L2 cache cell cause the L1 misses. For this reason, the cells in the cache display only summarize data relevant to the specific level of cache represented by the display, namely:
To handle set associativity using the static cache display, two methods may be used: either cache memory may be laid out in a parallel fashion or cache memory may be laid out in an interleaved fashion. The parallel layout arranges cache memory as a number of separate arrays, with one array for each degree of associativity. The interleaved layout arranges cache memory as one large array, with one item present in each array element for each degree of associativity. For example, a 1K, 4-way set-associative cache may be laid out as four arrays with 256K elements each, or as one array with 256K elements, each element of which consists of 4 items. The parallel and interleaved layouts are easy to switch between.
The controls available for manipulating the static cache display are identical to the controls used to manipulate the static main memory display, with the exception of highlighting. Highlighting regions of a cache makes less sense than highlighting regions of main memory because of the non-invertible mapping between cache locations and main memory locations. Therefore, highlighting is not available with cache displays.
The dynamic cache display combines the layout and controls of the static cache display along with the time navigation tools of the dynamic main memory display to show the following data for each cell:
As with the dynamic main memory display, the dynamic cache display also allows the user to combine the duration since the last access with the occurrences of hits and misses to produce a display which flashes and decays and hits and misses occur.
The memory cell history display is activated by clicking on any memory cell in any of the other displays. The display is essentially a two-dimensional graph plotting the entire history of a single cell during the execution of the program. Time is represented on the horizontal axis while other values are represented along the vertical axis. For main memory cells, a typical display might plot hits and misses using a bar whose height reflects the duration of the penalty incurred, and whose color indicates how far into the hierarchy the accesses went before it hit (note that color and height are related in this example). For cache cells, a typical display might also plot hits and misses at the level of hierarchy represented by the cell, with height and color as previously described. For both main memory history plots and cache history plots, data might be labeled with a variable name extracted from the annotated trace.
Because some memory cells contain several memory locations, such as memory cells which represent cache lines, the history graph might be three dimensional, or it might consist of several overlaid two-dimensional plots and key.
One feature of the memory cell history display is to allow the quick selection of interesting periods of time, which can in turn be used jump to an interesting time on one of the dynamic displays. For example, if a user suspects that a particular array is not behaving well with the caches, the user may bring up the memory cell history display for a portion of the array, look for a period of time when that array is active, and then focus on the array during its active period using the dynamic main memory display.
Two examples of a Memory Cell History Displays can be found in the Examples section, below and even further below. The first example is of a main memory cell, and the second example is of a cache cell.
In order to clarify how the various visualizations may be used to understand a program's interaction with a memory system, consider the following code fragment:
| A Code Fragment |
|---|
|
|
| Figure 1: A code fragment which loops to add the contents of one array to a the contents of a second array, storing the result in a third array. |
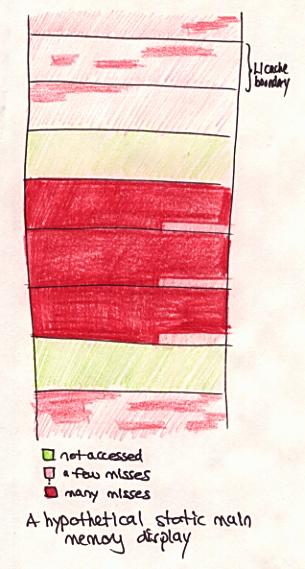
If the code fragment were to be repeated several times in the same program, and a memory trace were to be taken, the resulting Static Main Memory Display might look like the following:
| Static Main Memory Display |
|---|
|
| Figure 2: A Static Main Memory Display of the code fragment shown in Figure 1. Memory cells are colored to reflect the total number of misses seen, with light red shades indicating a few misses and dark red shades indicating many misses. Black lines denote L1 cache boundaries. |
A quick conclusion to draw from the display is that some regions of main memory experience a large number of misses. To get a closer look at the activity, one might choose to click on one of the dark red cells to obtain the following view:
| Memory Cell History Display for a Main Memory Cell |
|---|
|
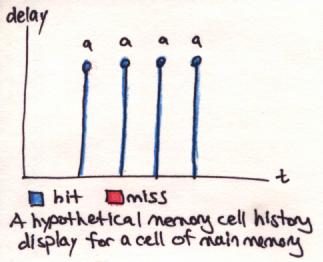
Figure 3: A Memory Cell History Display for a dark red main memory cell
in Figure 2. The display shows that, for the chosen memory cell, array
a was accessed four times, and that the data was found in main
memory all four times.
|
Having seen that display, one might decide that the array a[]
had something to do with the large number of misses seen on Figure 2. In
order to take a closer look, one can highlight the four blue bars on the
Memory Cell History Display to select a period of time, and then one can
bring up the Dynamic Main Memory display and watch an animation of the
selected time period. One frame of the animation might look like the
following:
| Dynamic Main Memory Display with Lines of Conflict |
|---|
|
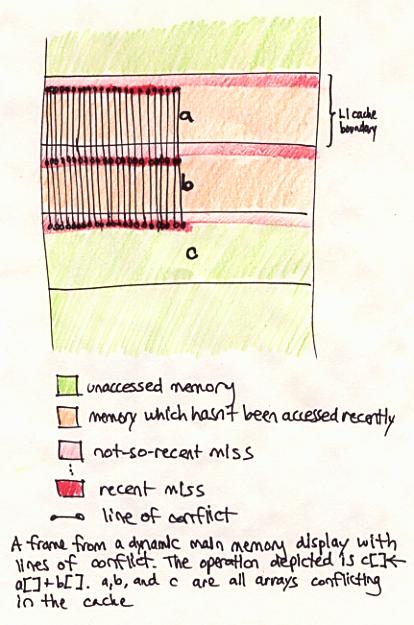
Figure 4: A Dynamic Main Memory Display of the data in Figure 2 at a
point in time in-between accesses to the memory cell depicted in Figure 3.
Lines of conflict are shown in this display. Note the presence of the
variable names for the a[], b[], and
c[] arrays, which are available in the dynamic display but not
in the static display.
|
The conclusion to be drawn from the Dynamic Main Memory Display is that
arrays a[], b[], and c[] conflict
with each other in the L1 cache. In fact, the three arrays are aligned
with one another and with the L1 cache boundary--an unfortunate situation,
as all accesses conflict with one another. By bringing up a view of the L1
cache and clicking on one of its memory cells, this view is obtained:
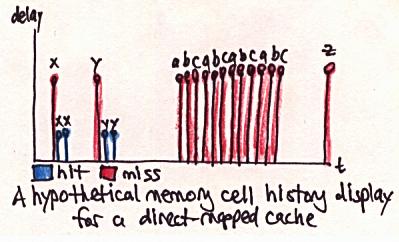
| Memory Cell History Display for a Cache Cell |
|---|
|
Figure 5: A Memory Cell History Display for a cache cell. The display
shows a misses for the variables x, y,
a, b, c, and z, and
hits for the variables x and y.
|
By noting that the variables a, b, and
c conflict consecutively four times, one can verify the
hypothesis that the three variables conflict in the cache.
Of the five displays introduced, perhaps the two main memory displays plus the Memory Cell History Display are the most useful, as most of the information available on the cache displays is also available on the main memory displays, especially if lines of conflict are activated. In order to understand whether any of the displays are actually useful, it is going to be necessary to implement and test their key features. This will be left for later implementation.
| [1] | Alpern, B., L. Carter, and T. Selker. "Visualizing Computer Memory Architectures." Proceedings of the First IEEE Conference on Visualization. Visualization '90. Held: San Francisco, CA, USA, Oct. 23-26, 1990. USA: IEEE Computer Society Press, 1990, p. 107-13. |
| [2] | Hennessy, J. L. and D. A. Patterson. Computer Architecture: A Quantitative Approach, 2nd ed. San Francisco: Morgan Kaufmann Publishers, 1996, p. 373. |
| [3] | Rosenblum, M., et al. "Complete computer system simulation: the SimOS approach." IEEE Parallel and Distributed Technology: Systems and Applications, Vol. 3, No. 4, Winter, 1995, p. 34-43. |
Last updated by Kekoa Proudfoot on October 31, 1996.
Send comments to
kekoa@graphics.stanford.edu.