The task in this assignment is to use an existing visualization tool to answer a specific question using data. You should maintain a web notebook that documents all the steps you performed, from start to finish, while creating the visualization. The goal of this assignment is not to develop a new visualization tool, but to understand better the process of creating the visualization.
Visualization
The effectiveness of the High-Low card counting system
Card counting is a mental technique used in Blackjack that provides an
advantage to the player over the house. Hi-Low is one such card counting
system that is very popular and simple. Like all other counting systems,
Hi-Low keeps track of a true count which quantitatively describes
how rich the remaining cards are in A,10,Q,J,K cards. Below, I illustrate
the effectiveness of the Hi-Low counting system compared to basic strategy
by plotting the player's advantage over the house at various true counts.
The data was computed from a simulation running over 500 million
hands. Blackjack rules were: 2 decks, 75% penetration, no cover bets, and
dealer hits on soft 17. Data courtesy of the Blackjack Data Repository.

The figure above shows a strong relationship between the true count and
the player advantage. When no card counting system is used (ie: basic
strategy), the player has a -0.35% advantage. This corresponds to when the
true count is 0. However, as the true count increases, we see that the
player gains a significant advantage over the house (about 8.25%). This
means that if we consistently bet $100 only on hands where the true count
is 9, we can expect to get $8.25 per every $100 in the long run. The
figure above also plots the win rate (in number of hands) as a function of
true count. Although the win rate is consistently less than 50%, the
player still maintains a positive advantage when the true count is 0.5 and
above. This illustrates that the player advantage is less related to the
win rate and more to the betting size.
|
Web log
Recently I've had an interest in card counting for Blackjack. While the
game itself isn't that interesting, when one uses a card counting
system, this adds an element of skill to the game of luck and
suddenly how one wins or loses depends on both skill and luck, and things
become much more interesting. It's well known that amongst all the
gambling games in the casino, Blackjack is one of the games that has the
smallest house advantanges. At less than 1% house advantage, it's
conceivable that a simple counting system could turn the tables to be
advantageous to the player.
Having heard stories of the infamous MIT Blackjack
team, one obvious question to ask is, "Does card counting in Blackjack
help you win money?" This question however, is ill posed. Which card
counting system should we use? Under which variations of Blackjack are
we playing? What constitutes "winning money"?
After some research, I narrowed my question to a precise, well-defined
one:
When a Blackjack player uses the Hi-Low card counting system, what
percentage does he gain over the house?
For someone new to the world of card counting, this question deserves some
explanation and a short introduction to card counting. "Hi-Low" is an
older card counting system that was popularized in the 60's by Ed Thorp
in his book "Beat the Dealer". The system was so successful that it
caused wipespread panic in the casinos and forever changed the rules of
Blackjack. For example, today if a dealer deals to the bottom of the deck,
it can be grounds for dismissal. Dealing to the bottom of the deck gives
more advantage to a player who is counting cards since his "count" is more
accurate as the number of cards in the remaining deck shrinks.
There is a common misconception that card counting requires someone to
actually remember all the cards that have been played and to perform
enormous calculations in their head. However, card counting strategies are
based on a simple principle; on one level or another, these strategies
keep track of the ratio of high-valued cards to low-valued cards. Through
simulation, it has been shown that when a deck is rich in high-valued
cards, the player tends to win more money. Intuitively, this is because
when a player gets a natural (ie: Blackjack), he is normally paid 3:2 of
his initial bet (and only loses his bet when the dealer receives a
natural). The second reason is that the player has the option of
"standing" on his present hand, whereas a dealer must hit on a hard 16 or
lower.
In order to keep track of this important ratio, we assign integer values
to each value a card can take. In Hi-Low, card values from 2-6 have value
+1. 7,8,9 have value 0. A,10,J,Q,K have value -1. This is known as the
running count. For example, if you saw the following sequence of
cards: K,Q,8,J,4, the running count would be -2. Naturally, a running
count of 4 when the shoe is mostly full should have a lesser weight than
when the shoe is almost empty. For this reason, we divide the running
count by the (estimated) number of remaining decks to obtain what is known
as the true count. In the data shown below and in the discussion,
"count" will refer to the true count. Hi-Low happens to be a balanced,
level 1 counting system which is still very popular today for its
simplicity and fairly good betting correlation (for details, see Thorp's
book, "Beat the Dealer").
The count tells a player how much money to bet and when to deviate from
basic strategy. Using this technique, one can increase the player
advantage over the house to a positive amount. Player advantage is the
expected earnings of playing Blackjack over many many hands.
Returning to answering the posed question, my first task was to find a
database which could answer my question. Luckily, many people have thought
of this question before, and a website called the Blackjack Data Repository had just the
information I needed. Their website contains tables of different
variations of Blackjack, with different kinds of card counting strategies
along with win/loss statistics based on hands played, bet amounts and much
more.
The first thing I did was request a table based on my choice of the Hi-Low
counting system and a common set of Blackjack rules variations:
- the dealer has 2 decks, where a reshuffle occurs after 75% of the
deck has been dealt (75% penetration)
- a standard betting strategy where the player bets 1 unit on a count
of 1 or less, 2 units at a count of 2, 4 units at a count of 4, 6
units at a count of 4, and so on.
- the dealer hits on a soft 17
- the counting system is High-low
|
Other details of the simulation can be found here.
This outputs a table in html, which I copy and paste into Excel. As a side
note, I was not aware of this feature until recently when somebody told me
about it, and it's a great alternative to writing a perl script to parse
html tables into a tab-deliminated format. Here's a screenshot of the
table from the web site:
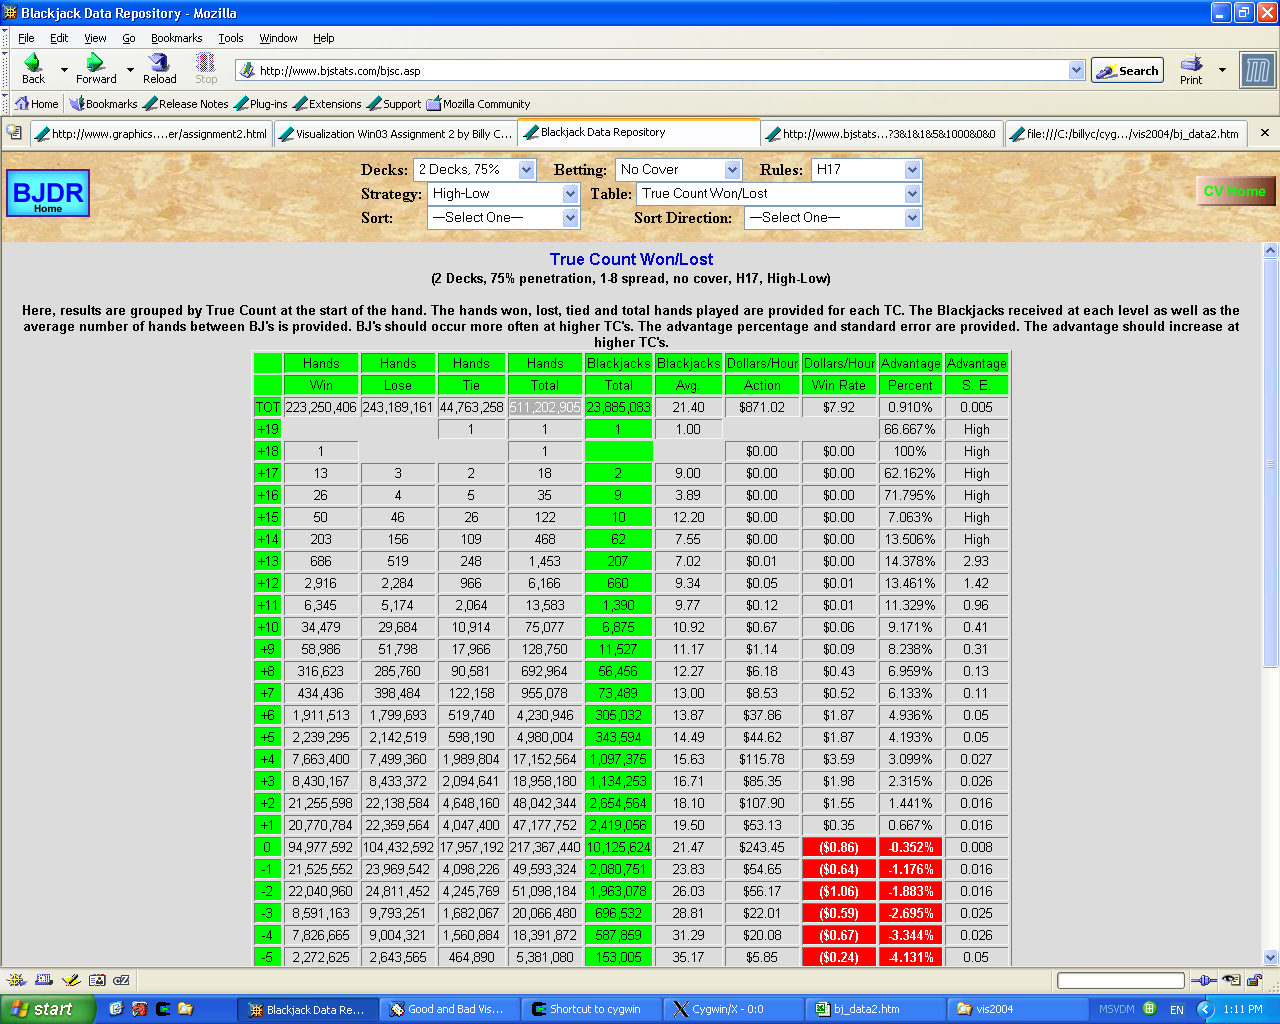
The raw Excel data is in xls and
html.
After importing the data into Excel, I relabeled some columns with titles
that make more sense to me, and started playing around with the
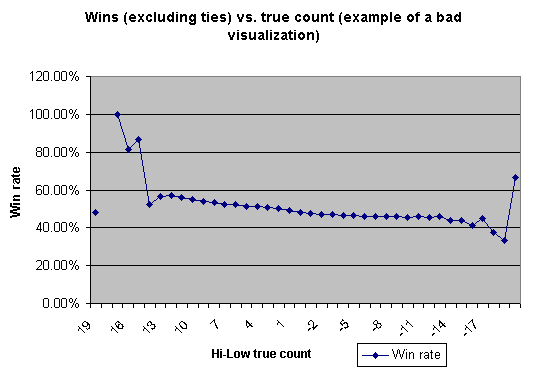
data. First, I plotted the percentage of winning hands ( including ties)
vs. the true count, having the true count range from -19 to 19. However, I
could tell right away that something was very wrong. The first problem is
that the ends of the plot spiked up radically and didn't follow the global
trend of the graph. Upon closer inspection, these outliers were only
computed from a very small number of hands, sometimes only one hand! I'll
discuss how I solved this problem later on. Here's a screenshot of that
bad visualization:
The second problem is much more subtle. The data I
plotted doesn't answer my original question. In fact, it implies a slightly
misleading conclusion that as the true count increases, the winning rate
increases (which is true), which is why the player advantage increases
(which is not entirely true). Additionally, the winning rate doesn't
account for ties, so the rate that is plotted is actually higher than the
actual winning rate. In my final visualization, I remedy these errors by
directly plotting the player advantange vs. the true count, and I show
that the player advantange is not as correlated to winning rate as my
first graph implied. An important lesson learned here: visualizations are
important tools but if done in a haphazard manner, can be extremely
dangerous in misrepresenting the data.
Next, I tackled the issue of which data to throw away. It turns out that
in the table, there are also standard errors for each player advantage for
each true count. Adding or subtracting the standard error from each player
advantange gives me the high and low advantanges at that true count.(see
Rioe, John A, "Mathematical Statistics and Data Analysis", 2nd Ed. Duxbury
Press, Belmont, California, 1995). For several of the extremely postive
and negative true counts, the standard error were listed as "HIGH". For
such entries, I ignored that row completely. This left the true counts
from 13 to -14. Just to verify my work, I plotted a graph of the standard
error of the player advantage over the true count:

Plotting such high and low values in
Excel requires going through some loopholes and setting up a "Stock
Chart". This chart requires me to calculate the highs and lows as separate
(adjacent) columns, as opposed to just computing them from the standard
error. This is somewhat annoying, but doable. It's clear that at the ends
of the graph there's a higher standard error. However, the misbehavior as
seen in the first graph is now gone. For the final visualization, I chose
only to plot true counts from 9 to -9.
Next, I compute the player advantage. I know from the betting columns,
that if I divide the total betting I won over the total betted units, I
should get my winning rate (player advantage) for that particular count.
Essentially, this means that over many trials at a given count, I should
get that percentage in return. In other words, that percentage is the
chance that I win that hand a that true count. Doing this calculation and
comparing these values to the "Advantage percent" column, I found that the
numbers match except for one, which I believe is an error in the
table. One nice habit I've developed from this assignment is to try to use
the data from one part of the table to verify and confirm other data in
the table, a self consistency check.
After computing the player advantage, I started playing with the actual
presentation of the data. I chose to use a line graph to present the data.
Using a line graph is a natural way to present this of data data for these
reasons: 1) while the true count data is given as integers, there's no
reason to assume that the player advantages would change that drastically
between true counts. In fact, linear interpolation is a natural
approximation given the global linear-like shape of the points. 2) line
graphs allow us to quickly identify cross-over points on the graph. Here, the
cross-over point is significant in that at a true count of 0, only basic strategy
applies and this is essentially the case where a player doesn't use a card
counting system (yielding a -0.35% advantage over the house). Since this
data has an implicit ordering (by true count), and the purpose is to show
a trend over true counts, it doesn't make so much sense to use a bar
graph, or pie graph or any other exotic graph that Excel provides. In
fact, these other graphs would only detract from the information I'd like
to present: the trend of player advantange over true count. Also, fiddling
with the scale of the graph can emphasize or de-emaphasize certain aspects
of the graph. Because I'd like to focus the cross over point, I'd like the
labels to be clearly visible, and the slope to be around 45 degrees.
One should be careful when scaling in Excel, I've learned that when scaled
too small, Excel will only approximately plot points to the
correct x-location. This is annoying when you want to exam a detail, such as
the player advantange at a true count of 0.
In the same graph, I also plot a line graph of win rate over true count.
It's obvious from the graph then that even when we on average lose more hands
than we win, we still end up with an advantage over the house! In fact, we
can consistently lose more than half of our Blackjack hands and still win
money. This dispels the previous misconception that the player advantage
is entirely correlated to the win rate.
On a technical note, when actually generating the visualization image,
Excel provides no means (that I know of) for exporting individual charts
to images. I had to screen copy and crop in Adobe Photoshop, which is
slightly annoying to do. The image is png since this gives me a compact
lossless compression scheme (unlike jpg) that is not copywrited (unlike
gif) and is well supported in web browsers.
At this point, I had already found the answer to my original question. The
graph shows a strong relationship between the true count and the player
advantage. When no card counting system is used, the player has a -0.35%
advantage. This corresponds to when the true count is 0. However, as the
true count increases, we see that the player gains a significant advantage
over the house (about 8.25%). This means that if we consistently bet $100
only on hands where the true count is 9, we can expect to get $8.25 per
every $100 in the long run. Great!
Other interesting things
As I plotted the final graph, I
realized that one could also examine an average player advantage over a
deck which will have true counts ranging from 0 to 9. This is a more
realistic case since the casino won't usually let a card counter enter the
table in the middle of a deck when the true count is high (called
"Wonging") and leave when the true count is 0. In this case I need to
normalize my player advantages over the frequency in which these
advantages occur. This is easily done in Excel by dividing the number of
hands of a particular true count by the total number of hands dealt. This
"occurence rate" is multiplied against the player advantage to get the
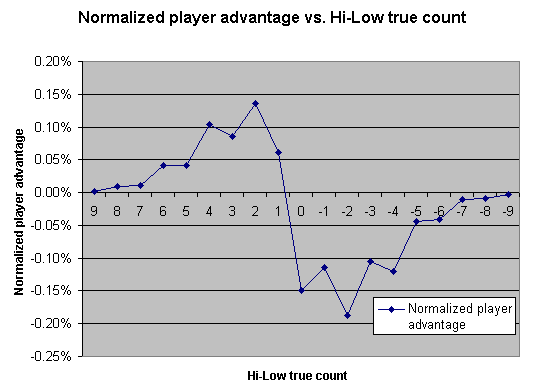
"Normalized player advantage" column. Below, I show a plot of the
normalized player advantage vs. the true count. The graph shows that
because lower counts occur more frequently, even though the player
advantage is lower, the normalized advantage turns out to be better than
higher counts.
The normalized advantage has another advantage: it provides a basis for
comparison between different card counting strategies. Of course I
realized that right after answering my original question, I wanted to know
"How does Hi-Low compare to other card counting strategies?" To answer
this question, I can't just compare player advantages over different true
counts in each card counting system. The reason is that each system has a
different method for computing a true count (based on different weights
for each card). However, I can answer that question by comparing the
expected advantage for true counts from 0 to 9 for each card counting
system. The expected advantage for true counts from 0 to 9 is simply
the sum of the normalized player advantages. Of course, by only looking at
the true counts from 0 to 9, I'm analyzing how well a particular card
counting system performs under
good conditions. One could also analyze how well a card counting
system performs under bad conditions (ie: -1 to -9 true count) as
well. Below I show a bar plot of various card counting strategies and
their expected player advantage:
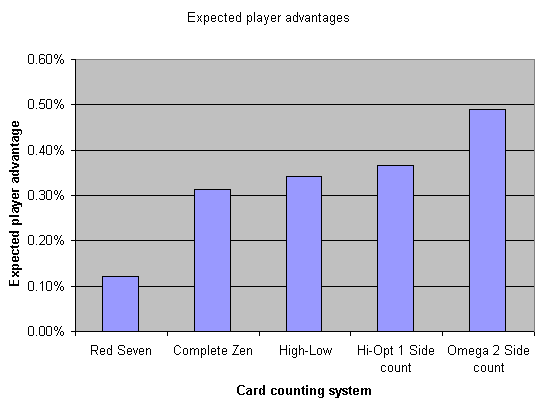
Here is the associated spreadsheet xls or
html
We see that Hi-Low performs about in the middle compared to other card
counting systems. Usually the trade off is higher player advantage for the
sake of more complexity (more side counts, different levels of addition,
and so on).
Design courtesy of Georg Petschnigg